
Over the summer we told you about an update to our core Prometheus data source, which was part of a larger shift in our effort to meet users where they are. It’s a change we’re really excited about, as it represents our biggest step yet toward enabling the creation of truly vendor-neutral data sources for Grafana.
As part of this effort, we deprecated AWS authentication from the original Prometheus data source, and we created a new dedicated Amazon Managed Service for Prometheus data source plugin that will specifically cater to the AWS use case. At the same time, we kept both data sources working by building the libraries they could consume. In fact, we made all the changes to the core Prometheus data source without introducing any instability.
We remain committed to being good stewards for the open source community, so we want to be transparent about the process. In this blog, we’ll recap what went into this project, in the hopes of inspiring the community to put this Prometheus library code to use in new and exciting ways. We also want to encourage other engineers—internally and externally—to do the same so Grafana can support better observability for third-party data sources, with code that’s reusable and independent from the Grafana release cycle.
Rethinking Grafana data sources
Before we get into the details of how we made this a reality, we first want to provide a bit more context on this project itself and how it ultimately affects our users.
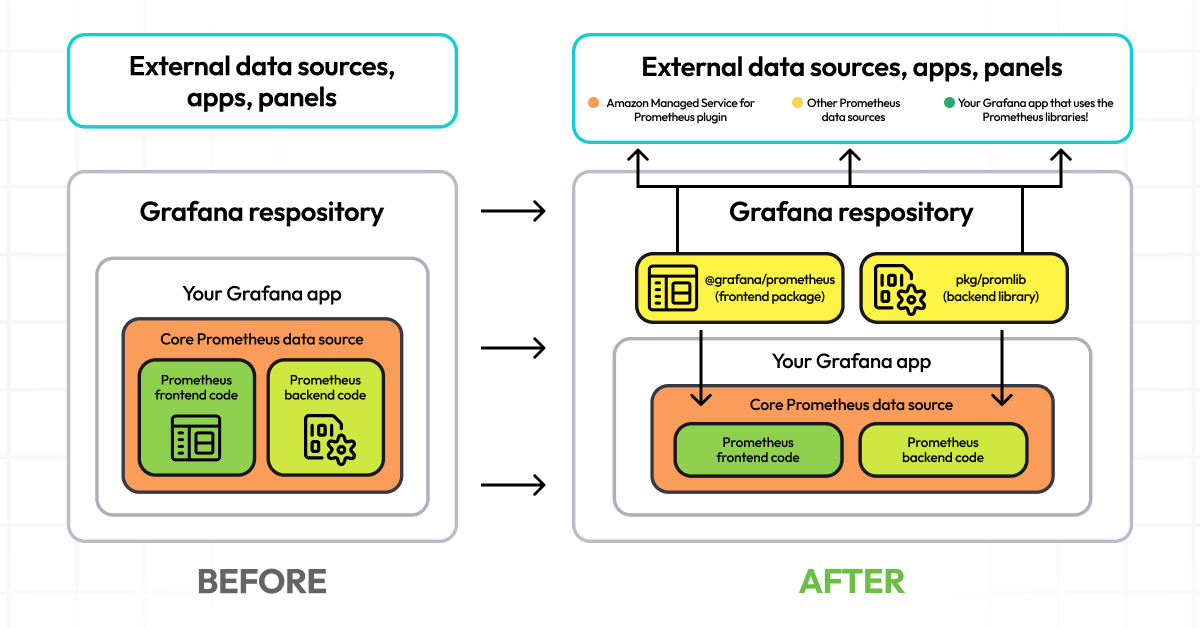
We went into this looking to decouple our Prometheus data source from Grafana so others could develop their own custom Prometheus data sources tailored to their specific needs. We did this by:
- Streamlining the core functionalities of the data source
- Fixing issues that resulted from coupling the core data source with Grafana ,such as imported code issues and custom code that was not related directly to Prometheus (e.g., AWS authentication)
- Creating libraries so additional vendors could reuse the shared code
Until now, Prometheus development in Grafana was tightly coupled with the core Grafana application. If you wanted to access the data source, you had to build inside Grafana and use code that was only available in our GitHub repo. But now, you can leverage the data source code in external applications and create new Grafana data sources based on Prometheus.
You can also create new Scenes apps that integrate with Prometheus code but aren’t exclusive to Prometheus. Plus, you get access to custom functions like the Prometheus query parser that handles Grafana variables as well as the custom rate interval function.
Ultimately, this work should give the broader Grafana community confidence as it adheres to good engineering principles that will set us up for better growth and success in the future:
- Do not repeat yourself (DRY): The core Prometheus data source and the Amazon Managed Service for Prometheus plugin share a majority of their code from the libraries. But because we used the libraries, we didn’t have to copy this code and use it in both. (Currently both data sources share a majority of functionality with regard to queries, variables, annotations, and most of the configuration. The main difference today is in the configuration, specifically the authentication section. The Prometheus data source has deprecated AWS SigV4 authentication and and the Amazon Managed Service for Prometheus plugin only offers SigV4 authentication.)
- Modularity: The library allows for reuse and replacement of parts that can be used in other projects or data sources, which is essential for application scalability.
- CI/CD: Our release process for this has already improved, and it will continue to do so as we iterate over time.
How we made it happen
For the remainder of this post, we’ll focus on the work that went into this project and what we have planned going forward.
The challenge at hand
The Prometheus data source has long existed as subfolders inside the Grafana application. It included all sorts of code from Grafana, and over time the data source made its way into many features related to our OSS projects, including Grafana Loki, Explore, and Grafana Alerting.
The code, however, couldn’t be reused outside Grafana, so over time custom configurations were added to accommodate third-party vendors. For example, the code config had logic that enabled AWS users to create a Prometheus data source connection inside Grafana to query their Prometheus data in AWS. This code lived next to generic Prometheus code, even though AWS authentication was related to Amazon managed services, not OSS Prometheus.
But when the idea was first proposed a little over a year ago, there was reluctance internally because of the heavy lift and requisite code changes. In fact, Grafana Labs had never undertaken a rewrite of this scale before. There are ~70,000 Prometheus queries in Grafana every day, and we were essentially suggesting that we tear out all the guts and put them somewhere—all without impacting that high volume of people who relied on it every day.
Building a POC
We began with a research spike and proof of concept. POCs are critical for this type of work, as we needed to show stakeholders that it was actually possible. We also needed to establish a reasonable estimate of the work that would be required, and we needed everyone to have confidence that it was the right move.
We used the existing code scaffolding to support the creation of new external data sources, such as the Amazon Managed Service for Prometheus plugin. We copied and pasted the core frontend code and the backend code into the new data source. We also eliminated over 250 import errors, and we created workarounds where those fixes weren’t enough, which will be addressed in the months ahead now that the code is stable.
We configured the data source successfully. Then we successfully queried the new data source, proving the work was doable.
If you want a closer look at what went into this, check out these links:
- We created the plugin with scaffolding with the
create-pluginCLI.- We created the actual AMP repository here.
- The initial commit for the repository was started on Sept. 21, 2023.
- The branch to test everything was working here, as of Oct. 20, 2024.
We plan to do the same update in regards to Prometheus and Microsoft Azure, and we will continue to explore how to make other data sources in the Grafana ecosystem more purpose-built over time.
Splitting responsibilities and cutting code
Once we got buy-in from the rest of the org, we decided to split the duties so we could work simultaneously. (Brendan on the frontend; Ismail worked on the backend.) This decision saved us at least six months of time and gave us additional confidence knowing two sets of eyes were checking the changes.
Along the way, Ismail removed more than 3,000 lines of legacy code, which improved readability, reduced the size of the codebase, and ultimately made it easier to maintain.
We looked at multiple ways to separate the frontend and backend code:
- Create a separate repo only for backend code
- Move all the frontend and backend code into an entirely new repo
- Create workspaces
We went with the third option, as the other two would have created more problems. As a result, we introduced GoLang workspaces to the grafana/grafana repository for the first time. We started by making a small package as a module to test, then we updated our build pipeline in Grafana and our linting code. We also made a Prometheus backend as a module and iterated from there.
By having Go modules, we improved our grafana/grafana repo and allowed other engineers to have their own modules inside grafana/grafana. So while the code is still in one place, it’s separated thanks to go workspaces, giving us separate versioning and total control of our code.
Testing our pipelines
From there, we worked on our CI testing so we had confidence that switching to the frontend package and backend library wouldn’t break any functionality and to ensure the Prometheus data source everyone knows and loves remains dependable. We also increased our end-to-end testing coverage by roughly 5x to cover all significant parts of the query editor, annotations, and configuration editor. Once we switched over and the tests were green and the queries still worked, we were assured that the data source would continue to work seamlessly for users.
We also worked on our CI/CD pipeline by switching from custom actions to GitHub workflow. We did this so we could run tests on multiple versions of Grafana, improve code quality, improve compatibility with other plugins, and make it easier to release plugins across multiple dev environments.
Keeping the lights on
As we mentioned earlier, we were able to keep the core Prometheus data source running as we built these libraries. However, it wasn’t entirely seamless behind the scenes. For example, we decided to pause building any new features and performance upgrades in the code while we did our work.
We used this opportunity to switch to default support for label values with match[ ] parameter endpoints, but that surfaced some bugs that we had to address. We also exposed a bug when we noticed some backend functionality hadn’t been migrated during previous work done on the core Prometheus data source.
Still, we were able to address these without any noticeable impact on users, and we made sure any of the core Prometheus users didn’t have to make any changes on their end as a result of our work.
The final result
Collectively, the work took roughly six months and required two dedicated engineers and regular check-ins with other stakeholders. And when we were confident the work was ready for production, we published the libraries so we could use them in our Prometheus data source and our external Amazon Managed Service for Prometheus plugin. (Check out our blog post from earlier this summer for more details on how to use the Amazon Managed Service for Prometheus plugin, why they should, how they can and what they need to do to migrate.)
What’s next
It was a lot of work to get to this point, but we’re not done yet. Next, we’ll create the versioning strategy for the frontend and backend libraries, and we’ll build more Prometheus data sources for other vendors.
More than anything, we want to hear from you! How will you use the libraries? How can we improve them to make them more useful? What would you like exported from the libraries?
To share your feedback, you can create issues directly in GitHub via the appropriate repo: @grafana/prometheus for frontend, pkg/promlib for backend. We’ve also created a list of major PRs and proof of concept PRs we used to make the libraries. We have added the GitHub label “prometheus-library” to organize them. If you are interested in adding to our work, please create an issue and tag it with the “prometheus-library” label.