
One of the biggest advantages of the OpenTelemetry project is its vendor neutrality — something that many community members appreciate, especially if they’ve spent huge amounts of time migrating from one commercial vendor to another. Vendor neutrality also happens to be a core element of our big tent philosophy here at Grafana Labs. We realize, however, that this neutrality can have its limits when it comes to real-world use cases.
In this post, we’ll explain vendor neutrality in the context of the open source OpenTelemetry project, including where it starts and ends, and how you can take advantage.
Three key layers of telemetry
Before we dive deeper into the concept of vendor neutrality, let’s look at the bigger picture, as it relates to telemetry and the OpenTelemetry project. In general, telemetry approaches usually involve three layers:
- The apps and infrastructure: This is the source of the telemetry — meaning, the actual thing we will be observing.
- The telemetry collector: This is software that collects, filters, processes, and forwards telemetry signals.
- The telemetry backend: This can be broken down into two further layers: storage and exploitation, which is how we extract value out of telemetry signals. For example, at the exploitation layer, an SRE looks at a dashboard and determines that a particular service needs investigation.
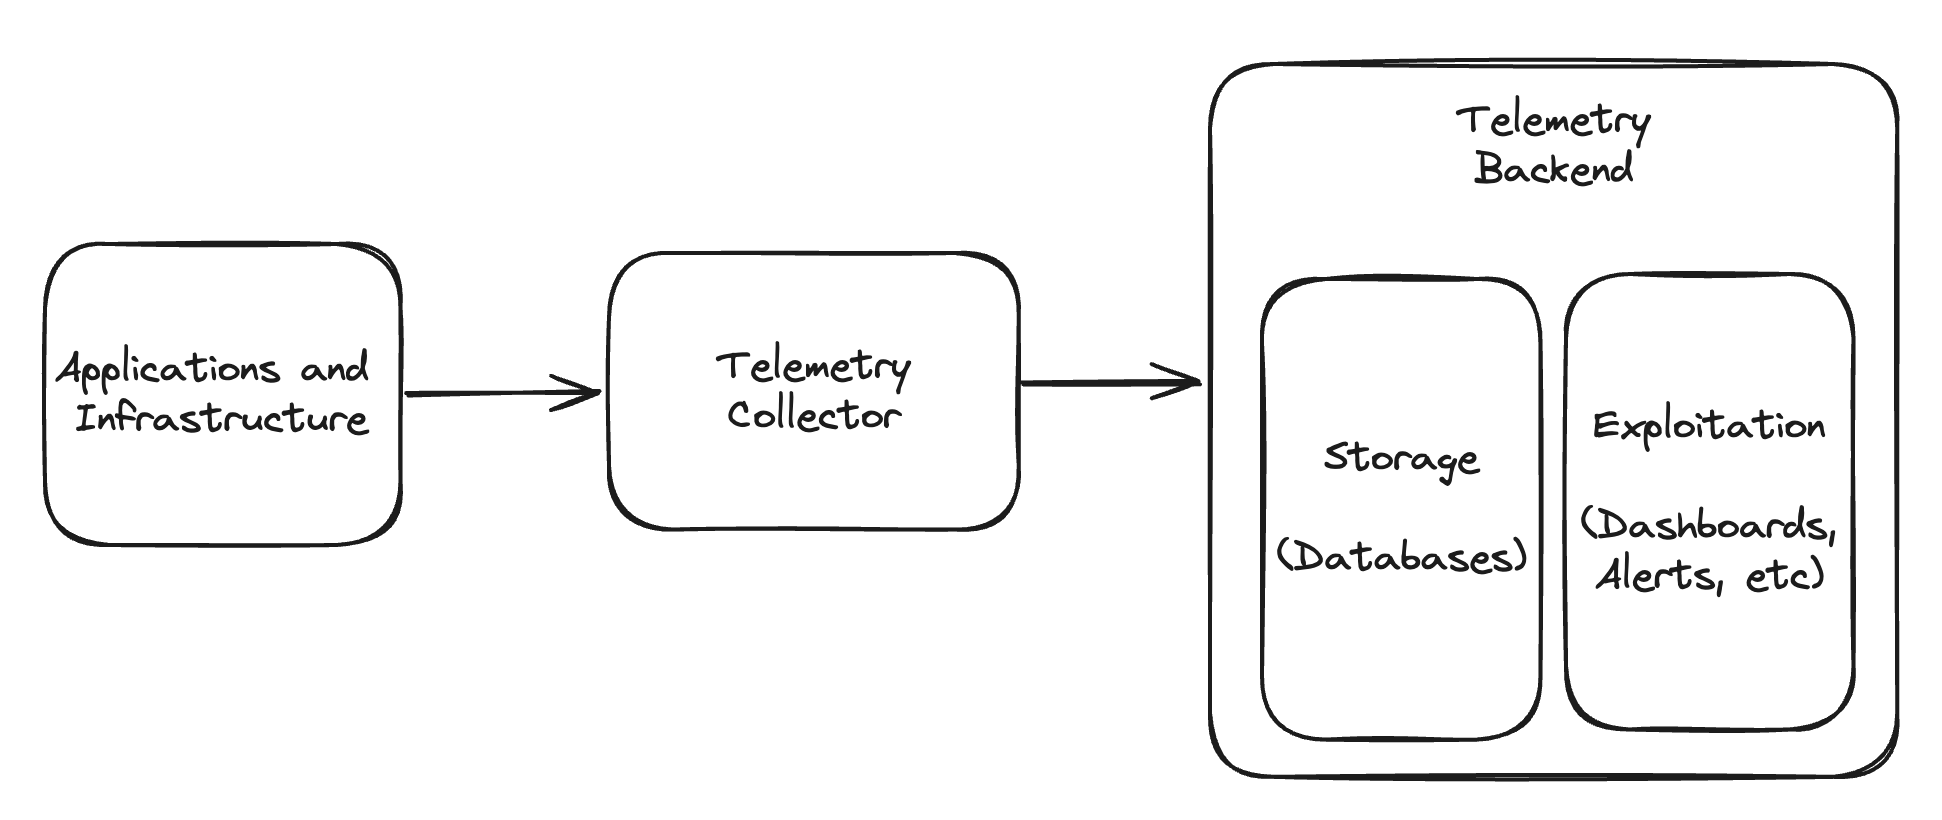
You can get quite complex with all three layers, particularly the collector layer, but telemetry solutions usually have something in each category. This is a useful model to help ground what vendor neutrality means in this post, and how you achieve it.
OTel’s vision for vendor neutrality
OTel is very appealing to folks coming from commercial vendors because they’ve often been burned by the costs of switching from proprietary instrumentations, agents, and/or collectors. To quote the OpenTelemetry mission, vision, and values page (bolded emphasis is ours):
For decades, proprietary drop-in agents from monitoring and observability vendors have been the primary source for useful telemetry from across the application stack. Unfortunately, the lack of common standards or APIs across these agents has led to vendor lock-in for customers, and inhibited innovation by tightly coupling telemetry collection with telemetry storage and analysis. With OpenTelemetry, we strive to provide a level playing field for all observability providers, avoid lock-in to any vendor, and interoperate with other OSS projects in the telemetry and observability ecosystem.
There are two key points to draw out of this:
- Tight coupling between telemetry collection, storage, and analysis is a bad idea (more on this below).
- If you use a proprietary drop-in agent that does not conform to standards as a way of gathering telemetry, you will be locked into that vendor. This is because you cannot have a telemetry system without the data, and that vendor is the one way to get that data. That’s vendor lock-in (the opposite of vendor neutrality), in OTel terms.
Let’s take a deeper look at both of these points.
Loose coupling
Tight coupling is something we avoid in all software architecture work, because when system components (such as telemetry collection and exploitation) are tightly coupled, your flexibility to choose different options is limited. In other words, tight coupling facilitates lock-in.
OpenTelemetry, instead, facilitates “loose coupling,” because the standards and software you use for collection are independent from your backend. That’s a clear win. The way OTel components are built is also loosely coupled; you can use the SDKs without the collector, or a language-specific instrumentation API with a different SDK implementation. You can mix and match the various technical “pieces” of OpenTelemetry (the SDK, API, OTLP, and Collector) with other implementations.
Open standards
The second point is more complex, but just as important. A “proprietary drop-in agent” is something that represents and transmits telemetry data in a format only one vendor understands. This is where open standards really shine. A community agrees on the semantic conventions and on the wire representation (OTLP). Any open source telemetry collector that supports those things no longer exhibits proprietary lock-in. Two things to note here:
- Open source means anyone can contribute, modify, or fork; it cannot be owned by one company.
- Standards-compliant means the telemetry collector “speaks the agreed upon language” of OpenTelemetry semantics and OTLP.
OTel Collector is the first and primary telemetry collector that fits this bill, as a reference implementation.
Vendor lock-in is the opposite of those two facets: if you can’t fork or modify the collector, and if the collector doesn’t speak an open standard as its language, then you’ll be locked into using that vendor’s tools.
Telemetry backends
So far, we have been talking about sourcing, collecting, and processing telemetry. What about the backend?
In any architecture, eventually the data comes out of an OpenTelemetry-compatible collector, and goes into a database somewhere. That database might be Grafana Loki or Mimir, or it could be Prometheus, Elasticsearch, or something else. This is where vendor neutrality starts to look different.
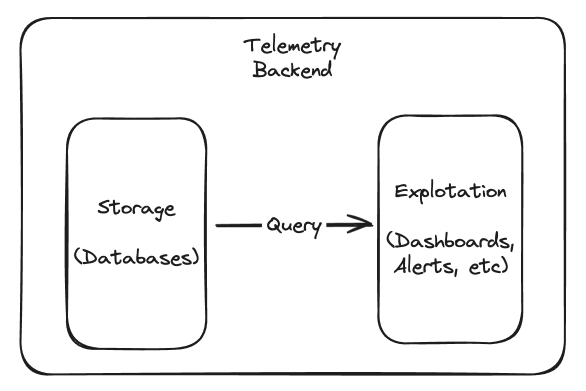
At this point, it’s no longer about telemetry data being sourced and flowing on the wire — it’s about telemetry data at rest in a database. To utilize that telemetry, we’re going to have to pull it out of the database, and slice and dice it with queries. No matter what database you choose, what matters most is the database’s schema and query language. It will likely respect the semantic standards, but you don’t query databases with OTLP.
Next, you’ll build some set of dashboards on top of the queries from that database, and you might build alerts and other things, regardless of the vendor you choose. When you do this, you’re out of the OpenTelemetry world, and unavoidably building product-specific resources. If you use Grafana Cloud, even if you’re feeding it with OTel signals, it may not be obvious how to migrate those usage patterns to a different backend, and the same is true for all other observability vendors. This is because there are no industry standards for things like dashboards and telemetry databases to adhere to. And, as stated on the “What is OpenTelemetry?” page, telemetry storage and visualization are beyond the scope of the OTel project (bolded emphasis, again, is ours):
OpenTelemetry is not an observability backend like Jaeger, Prometheus, or other commercial vendors. OpenTelemetry is focused on the generation, collection, management, and export of telemetry. A major goal of OpenTelemetry is that you can easily instrument your applications or systems, no matter their language, infrastructure, or runtime environment. Crucially, the storage and visualization of telemetry is intentionally left to other tools.
Vendor neutrality from different angles
Implementation effort creates sunk cost, which is a factor in how lock-in happens. In this sense, no technology provides a guarantee you can avoid vendor lock-in completely.
OpenTelemetry is about decoupling and providing options in the app/infrastructure layer and collector layer (the first two “layers” of telemetry); the third layer, telemetry backends, is where most teams put in the effort to customize their view. When they do, they have an investment that can be hard to migrate later. It’s like picking a programming language: if you write an app in Go, we wouldn’t say you’re “locked-in” to Go, but in choosing it, you’ve made it harder to decide to rewrite in Rust later.
What you get out of telemetry backends comes from your investment: you build visualizations that satisfy your team’s needs. Grafana helps people avoid lock-in by enabling them to build dashboards on top of any database they’d like; you don’t have to use Loki, Mimir, and Tempo. Still, the fundamental remains: implementation effort with any vendor creates customizations, which later limit switching with ease.
This is why OpenTelemetry cannot create vendor neutrality at the backend layer, which is a common source of confusion for enterprises implementing it. OpenTelemetry is great, but if you’re architecting a solution, it’s important to understand these nuances around vendor neutrality.
How to maximize your options
Start with apps and traces
OpenTelemetry comes from roots in tracing and applications, so it is strongest in cases where you’re instrumenting apps that need traces.
Using an OpenTelemetry SDK and OpenTelemetry-compatible collectors will decouple telemetry collection from storage and exploitation. This can help future-proof your architecture and leave you free to have maximum options at the backend layer.
Adopt in layers
We previously mentioned that OpenTelemetry components (SDKs, APIs, OTLP) are all loosely coupled, which means that you can pick and choose and adopt “layers” of OpenTelemetry as you go. There is simply no need to jump in all at once; layered adoption builds familiarity and mitigates risk. Standardizing at the protocol level of OTLP, though, might be a good first move, which can be done with an open source telemetry collector that supports OTLP.
This will let you pick and choose which language-specific APIs and SDKs make the most sense for your team. As long as they can write OTLP to a remote destination, you are in good shape. The world can be messy, though, and even if you can’t write OTLP directly from the source, often you can get your collector to emit OTLP, regardless of how the telemetry was gathered from the app. Within the app, if you choose to use non-OTel APIs for instrumentation, give preference to those that adhere to the semantic conventions, so you can benefit from tooling built elsewhere in the ecosystem, such as Grafana Cloud Application Observability.
Ensure reusable instrumentation
If you’re evaluating different backends, you can use the same instrumentation setup to push telemetry signals to two or more backends. This way, you can do a “bake-off” and evaluate which one is a better fit.
Even though you will invest effort to build the solution you need, you still get an extra point of flexibility: upgrades, maintenance, and changes in the telemetry layers are still decoupled, so you can change your collection approach and your backend approach freely without having to rebuild the entire system.
Learn more
OpenTelemetry’s original vision was to break out of the tight coupling found in older observability architectures. It also aimed to provide alternatives to proprietary drop-in agents that made switching telemetry backends difficult. The open source project has delivered on both points, and in this post, our goal was to provide some common-sense guidelines on how you can take advantage of that.
To learn more, check out our OpenTelemetry best practices post, as well as our post about recent milestones in the OpenTelemetry project and community.