
Introduction
At Mattermost, we’re on a quest to scale our application by one order of magnitude, from tens of thousands to hundreds of thousands of concurrently active users per installation.
Scaling up is a complex effort involving expertise at several different levels. At its core, it’s a game of catching the next bottleneck — whether it’s application CPU usage, memory consumption, database throughput, networking, or any combination of the above (among other causes as well).
To assess our product’s performance, we developed an in-house load-test tool that integrates into a reasonably standard monitoring stack based on open-source tools such as Prometheus, Grafana, and Pyroscope.
A set of thresholds on key metrics powers a feedback loop that controls the load of the agents throughout a test. This process allows us to automagically determine (through simple linear regression) how many users the application supports with a given configuration and deployment specification.
Setup
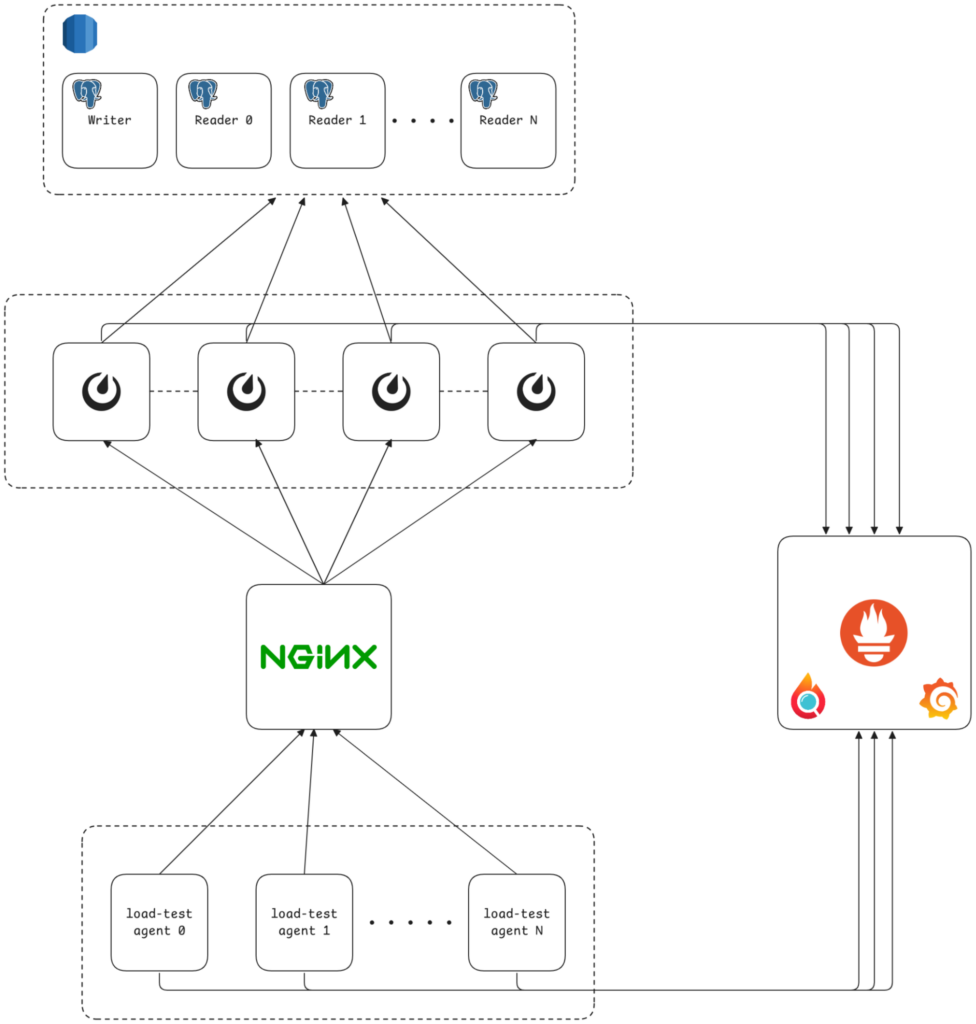
Our reference deployment is relatively standard. A load balancer (nginx) sits in front of a configurable number of application nodes running Mattermost, which are interconnected to form a cluster. Each Mattermost node also connects to an SQL database cluster (Aurora RDS) for persistent business data storage. Another instance runs Prometheus, which pulls app-level metrics from Mattermost and system-level metrics from all instances at regular intervals. That’s pretty much it.*
* In an actual deployment, there are more ancillary services, which I’m purposely omitting for simplicity’s sake since they weren’t relevant in the context of this investigation.
Problem
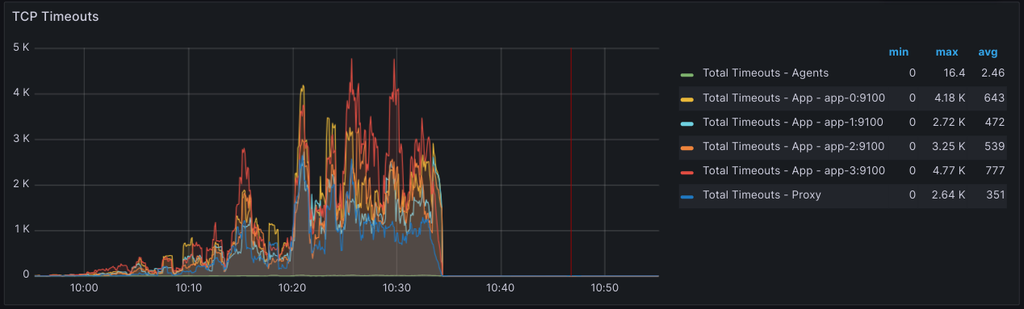
One of the thresholds we used to track overall performance was the percentage of TCP timeouts: a ratio between the number of timeouts (node_netstat_TcpExt_TCPTimeouts) and the number of currently established connections (node_netstat_Tcp_CurrEstab).
Our original value for the rate of TCP timeouts on the application nodes was 3%. This seemed like a more than reasonable value considering that all TCP traffic from and to application nodes flows under optimal conditions (i.e., the same VPC and same deployment region).
As we attempted larger tests, we started to hit this threshold with higher frequency. However, as there wasn’t any significant indication that our system was performing poorly, we ended up bumping it without truly understanding what was causing the timeouts. After all, all the latencies we tracked (e.g., API handlers, DB store methods, client requests, etc.) were still well under their respective thresholds.
Of course, bumping thresholds to achieve our desired results didn’t feel totally right, so we planned to conduct a proper investigation into the causes of the timeouts later in the quarter.
* A careful reader may notice that the image above shows the instant rate of timeouts rather than the ratio between timeouts and active connections. The above panel is what we include in our main performance dashboard which slightly differs from the actual threshold we monitor.
Investigation
Act I
I started the investigation with a set of tests specifically focused on monitoring network-level metrics (e.g., node_netstat_Tcp_* and node_netstat_TcpExt_*), which immediately revealed a direct correlation between the TCP timeouts and a significant increase in TCP segment retransmissions.
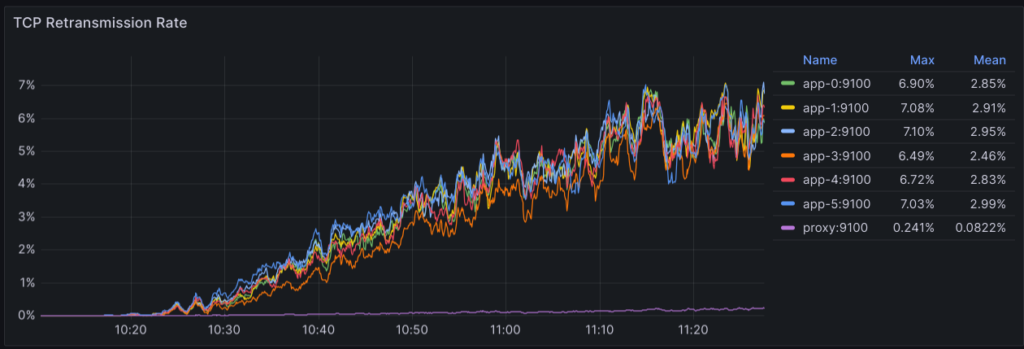
Another detail I noticed soon after was that the higher the number of app nodes in the cluster, the larger the chance of seeing retransmissions. In fact, I couldn’t reproduce the issue with a two-node cluster under similar conditions (e.g., number of connected users).
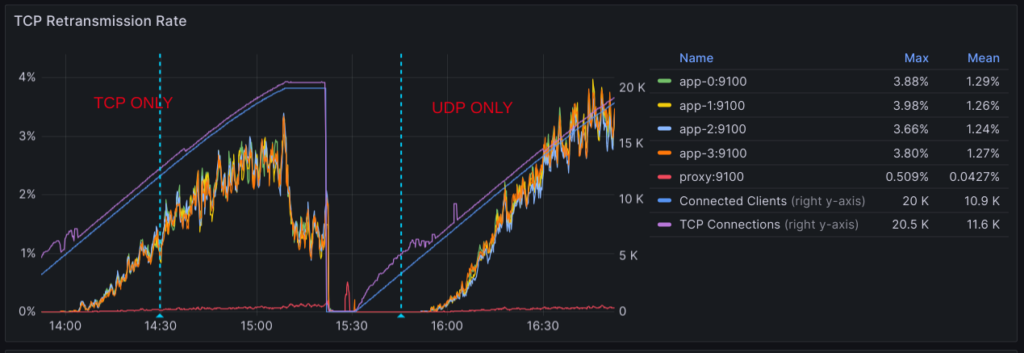
My initial theory was that intra-cluster messaging could be causing problems. This thought led to a sub-investigation that revealed significant optimization opportunities within our clustering implementation, such as using UDP instead of TCP to deliver messages more efficiently. Still, applying such changes only made things worse and didn’t help whatsoever to explain or solve the original issues of retransmissions and timeouts. This was a so-called red herring.
After this, I felt it was time to go a little deeper than what Prometheus metrics offered and look more closely at what was happening at the protocol level. This meant using tcpdump to collect a good sample of the actual traffic between instances while reproducing the issues, which could later be analyzed with Wireshark.
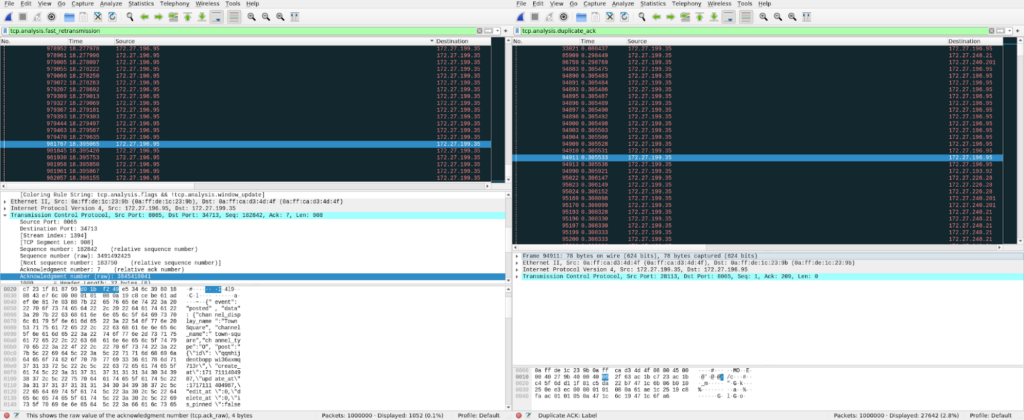
And that’s what I did. Examining the collected pcap dumps, I was able to discover a couple of interesting bits:
- Almost all retransmissions were triggered by duplicate acknowledgments coming from nginx’s instance.
- Most of the TCP retransmissions happened to be fast retransmissions.
- This turned out to be the main reason overall performance wasn’t affected as severely. The congestion control algorithm we used (BBR) performed exceptionally well and tolerated a high degree of packet loss.
- The majority of retransmissions were on packets forming WebSocket messages.
To understand further, I also played with the fantastic (and highly recommended) bpftrace utility, specifically the tcpretrans script, which confirmed both the nature and the source of the retransmissions we were seeing.
With the above information, I felt confident enough to move my focus entirely to the app<->nginx path. At this point, I had established what was happening in good detail but was still missing a clear understanding of why.
Act II
When it comes to understanding and troubleshooting networking issues at scale, there aren’t many better resources than the myriads of Cloudflare engineering blog posts — especially the ones that go deep into explaining every nuance of certain sysctl tunings or how the Linux kernel TCP stack works in detail.
Some things I tried (unsuccessfully) as I desperately wanted to see some progress:
- Disabling Nagle’s algorithm (aka TCP_NODELAY) on the sockets behind our WebSocket connections.
- I knew this caused significant pain in the past and didn’t want to take anything for granted. Interestingly, this resulted in a higher degree of both retransmissions and timeouts, the causes of which I’d only fully understand later.
- Tuning socket buffers (e.g.,
net.ipv4.tcp_rmemandnet.ipv4.tcp_wmem) to better match the expected BDP. This didn’t help either, as it had little to no change. - I went as far as changing the TCP congestion control algorithm back from BBR to CUBIC (Linux’s default), but to no avail.
At this point of the investigation, I had, with a decent degree of confidence, assessed the following:
- The application level (both Mattermost and nginx) was performing as expected.
- The operating system’s TCP stack on both sides was showing nothing unusual.
Act III
It was time to look further down the networking stack: at the NIC level. This is usually achieved through the use of the ethtool Linux command:
ethtool -S device_name
Doing so revealed some promising details. The bw_in_allowance_exceeded metric on nginx’s instance showed several millions of dropped packets. This came as a bit of shock, considering the application nodes were averaging less than 4Gbps outbound traffic in total while the nginx’s instance in use had an advertised baseline of 25Gbps.
This is when I was inevitably introduced to the concept of microbursts: sudden spikes in traffic that last a very short time (e.g., milliseconds). These are very hard to track because they require a superior resolution than most metrics collectors can offer.
With some help from AWS documentation, things slowly started to make sense. Naively bumping nginx’s instance size from m6in.4xlarge to m6in.8xlarge (25Gbps to 50Gbps baseline) showed good improvements, confirming that the issues could be directly related to bandwidth.
And then, all of a sudden, I remembered (from the pcap dumps) that the retransmissions were mostly WebSocket broadcasts. This was the Eureka moment of this entire ordeal and what ultimately led to a reasonable explanation for it all:
The application side was outperforming the capacity of the receiver’s (nginx’s instance) network card.
More specifically, WebSocket events, broadcast to tens of thousands of clients at once in a fraction of a second (more likely a couple tens of milliseconds) coming from multiple backends (deployment had four application nodes), was enough to exceed the (apparently high) capacity of the nginx’s instance’s network card.
Solution
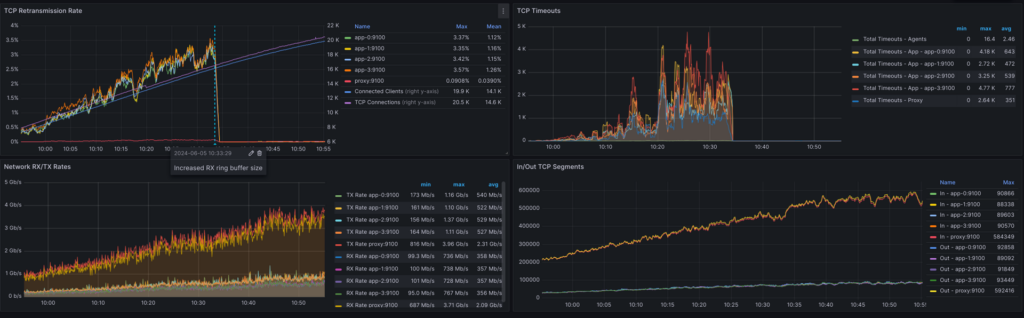
Increasing the Ethernet device’s receive ring buffer size from the default capacity of 1024 to the maximum supported of 8192 did the trick:
ethtool -G device_name rx 8192
The simplest of commands was all it took to instantly decrease both retransmissions and timeouts by a couple of orders of magnitude while keeping measured latencies well under their thresholds.
In hindsight, this made perfect sense: nginx’s side simply couldn’t keep up with the app’s bursty traffic, especially when dealing with sudden spikes of broadcasted WebSocket events.
Learnings
I won’t lie; the solution was so simple that it felt slightly disappointing after the many (at times) frustrating hours spent trying to understand what was happening. But after those negative feelings faded out, I reminded myself that it’s the journey — not the destination — that truly matters.
Here are a few insights I felt worth sharing, not in any particular order:
- Never sweep performance issues under the rug. They’ll come back to haunt you, eventually.
- Take your time. Performance investigations require extreme focus and attention to detail, especially when progress seems infinitely slow. Getting impatient won’t help. Instead, taking a break after a long dig can make a huge difference.
- Be mindful of red herrings. While a depth-first approach to problems is powerful, it has some inherent limitations. Understanding when it’s time to backtrack is critical.
- Document your steps during an investigation. It will help you better reason through it while it’s happening, and once it’s over, it will be much easier to spot issues with your process. As a bonus, notes will serve as an excellent base to, for example, turn your experience into a blog post.
- If your application does anything remotely interesting involving networking, consider enabling
ethtoolmetrics in the Prometheus node-level metrics exporter. They are not on by default. - Microbursts are a real thing. Average bandwidth and peak bandwidth are two very different concepts. You can still exceed your NIC’s allowance even when, on average, bandwidth is well below its capacity.
- eBPF is a lot of fun. Consider trying bpftrace and related tools. There’s a lot you can do and learn with them.
Get involved
If you’d like to know more about this particular investigation or discuss anything related to performance, you can reach out to the team in our public Developers: Performance channel.
I hope to see you there!
The post Investigating TCP timeouts at scale appeared first on Mattermost.