Metabase offers a few different types of embedding: interactive, static, and public embedding. With usage analytics, you can track how your customers interact with your customer-facing analytics.
The level of detail available in usage analytics depends on the embedding type. For example, interactive embedding gives you an additional capability to track usage tied to a log in, whereas usage stats, like views and downloads, with static and public embedding are anonymous.
However, this guide can give you a roundabout idea of how to start track usage analytics for embedded analytics.
See how often people use your customer-facing analytics
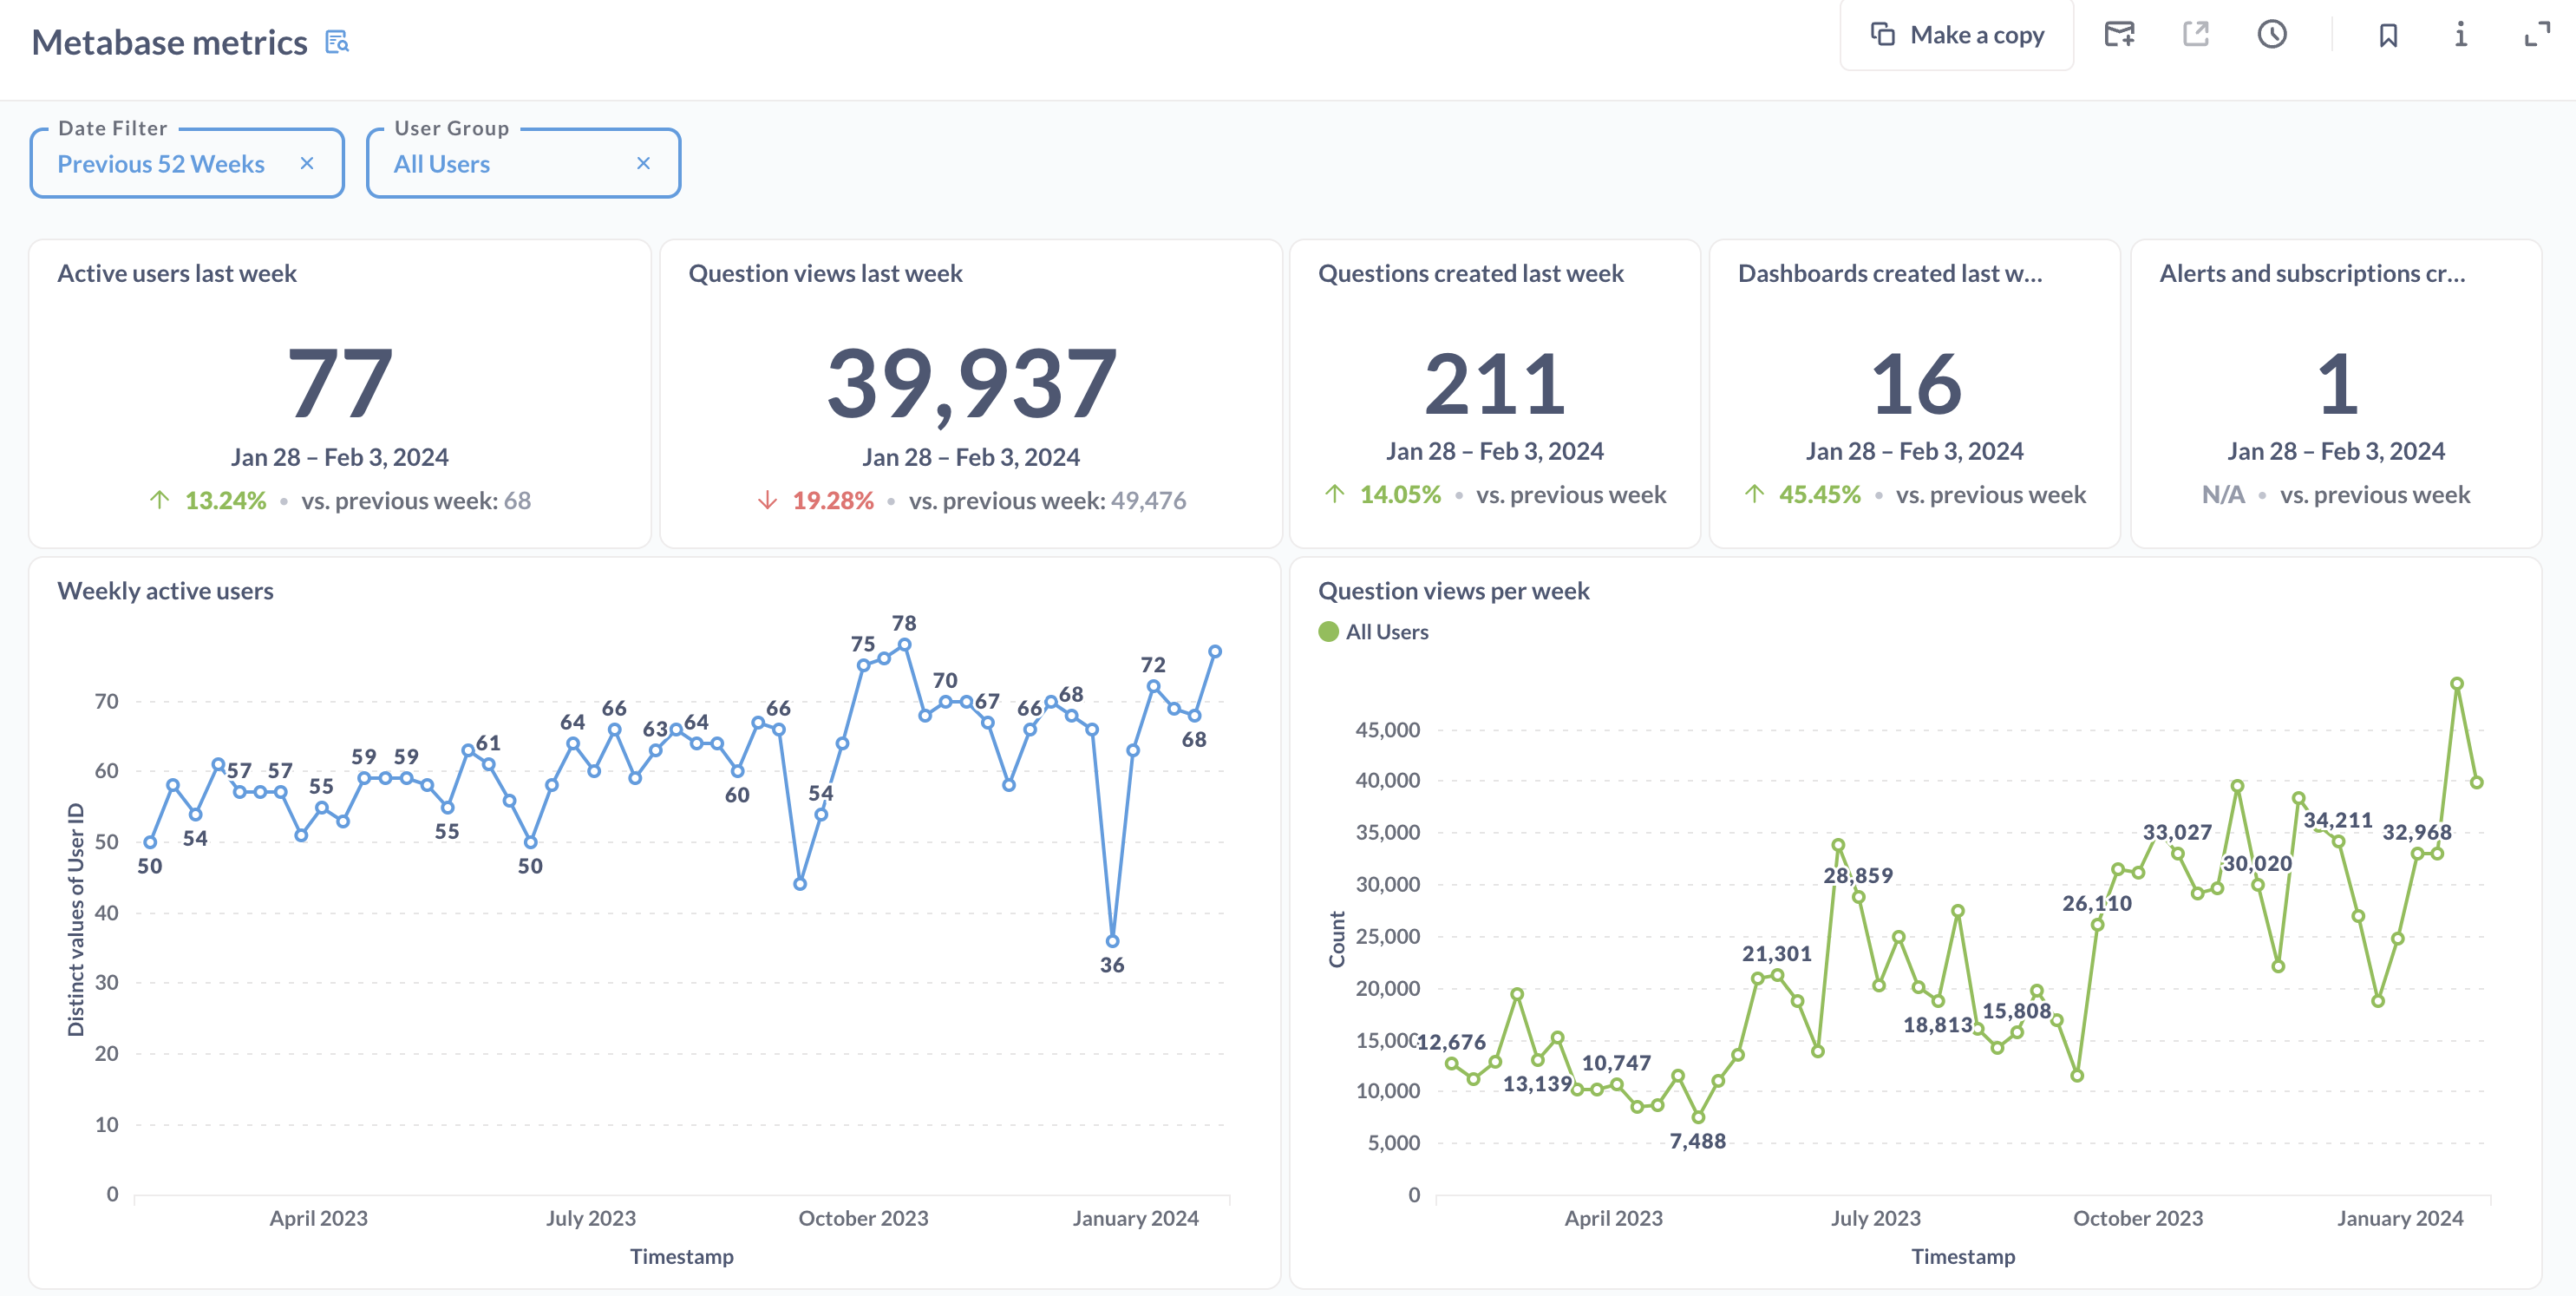
Justify your investment in embedding by keeping track of how often it’s being used. The Metabase metrics dashboard tracks how many active users you have, how many questions people are viewing and creating per week, and trends over time as usage changes week over week.

Understand what your customers are most interested in
In that same Metabase metrics dashboard, you’ll find a list of who your most engaged data consumers are. See what they’re looking at so you can create more relevant content geared towards their interests. Knowing what your customers actually care about can also lead to more meaningful conversations about how you can support them.
You can also learn when customers start to lose interest. For example, for interactive embedding, you can spot if a particularly active customer suddenly stops visiting your analytics. This could be a sign to reach out and see if they need your support.
For static and public embedding, you can look at usage in aggregate by filtering on anonymous to find what your customers are most interested in.
Keep questions and dashboards quick and minimize friction so your customers can self-serve what they need
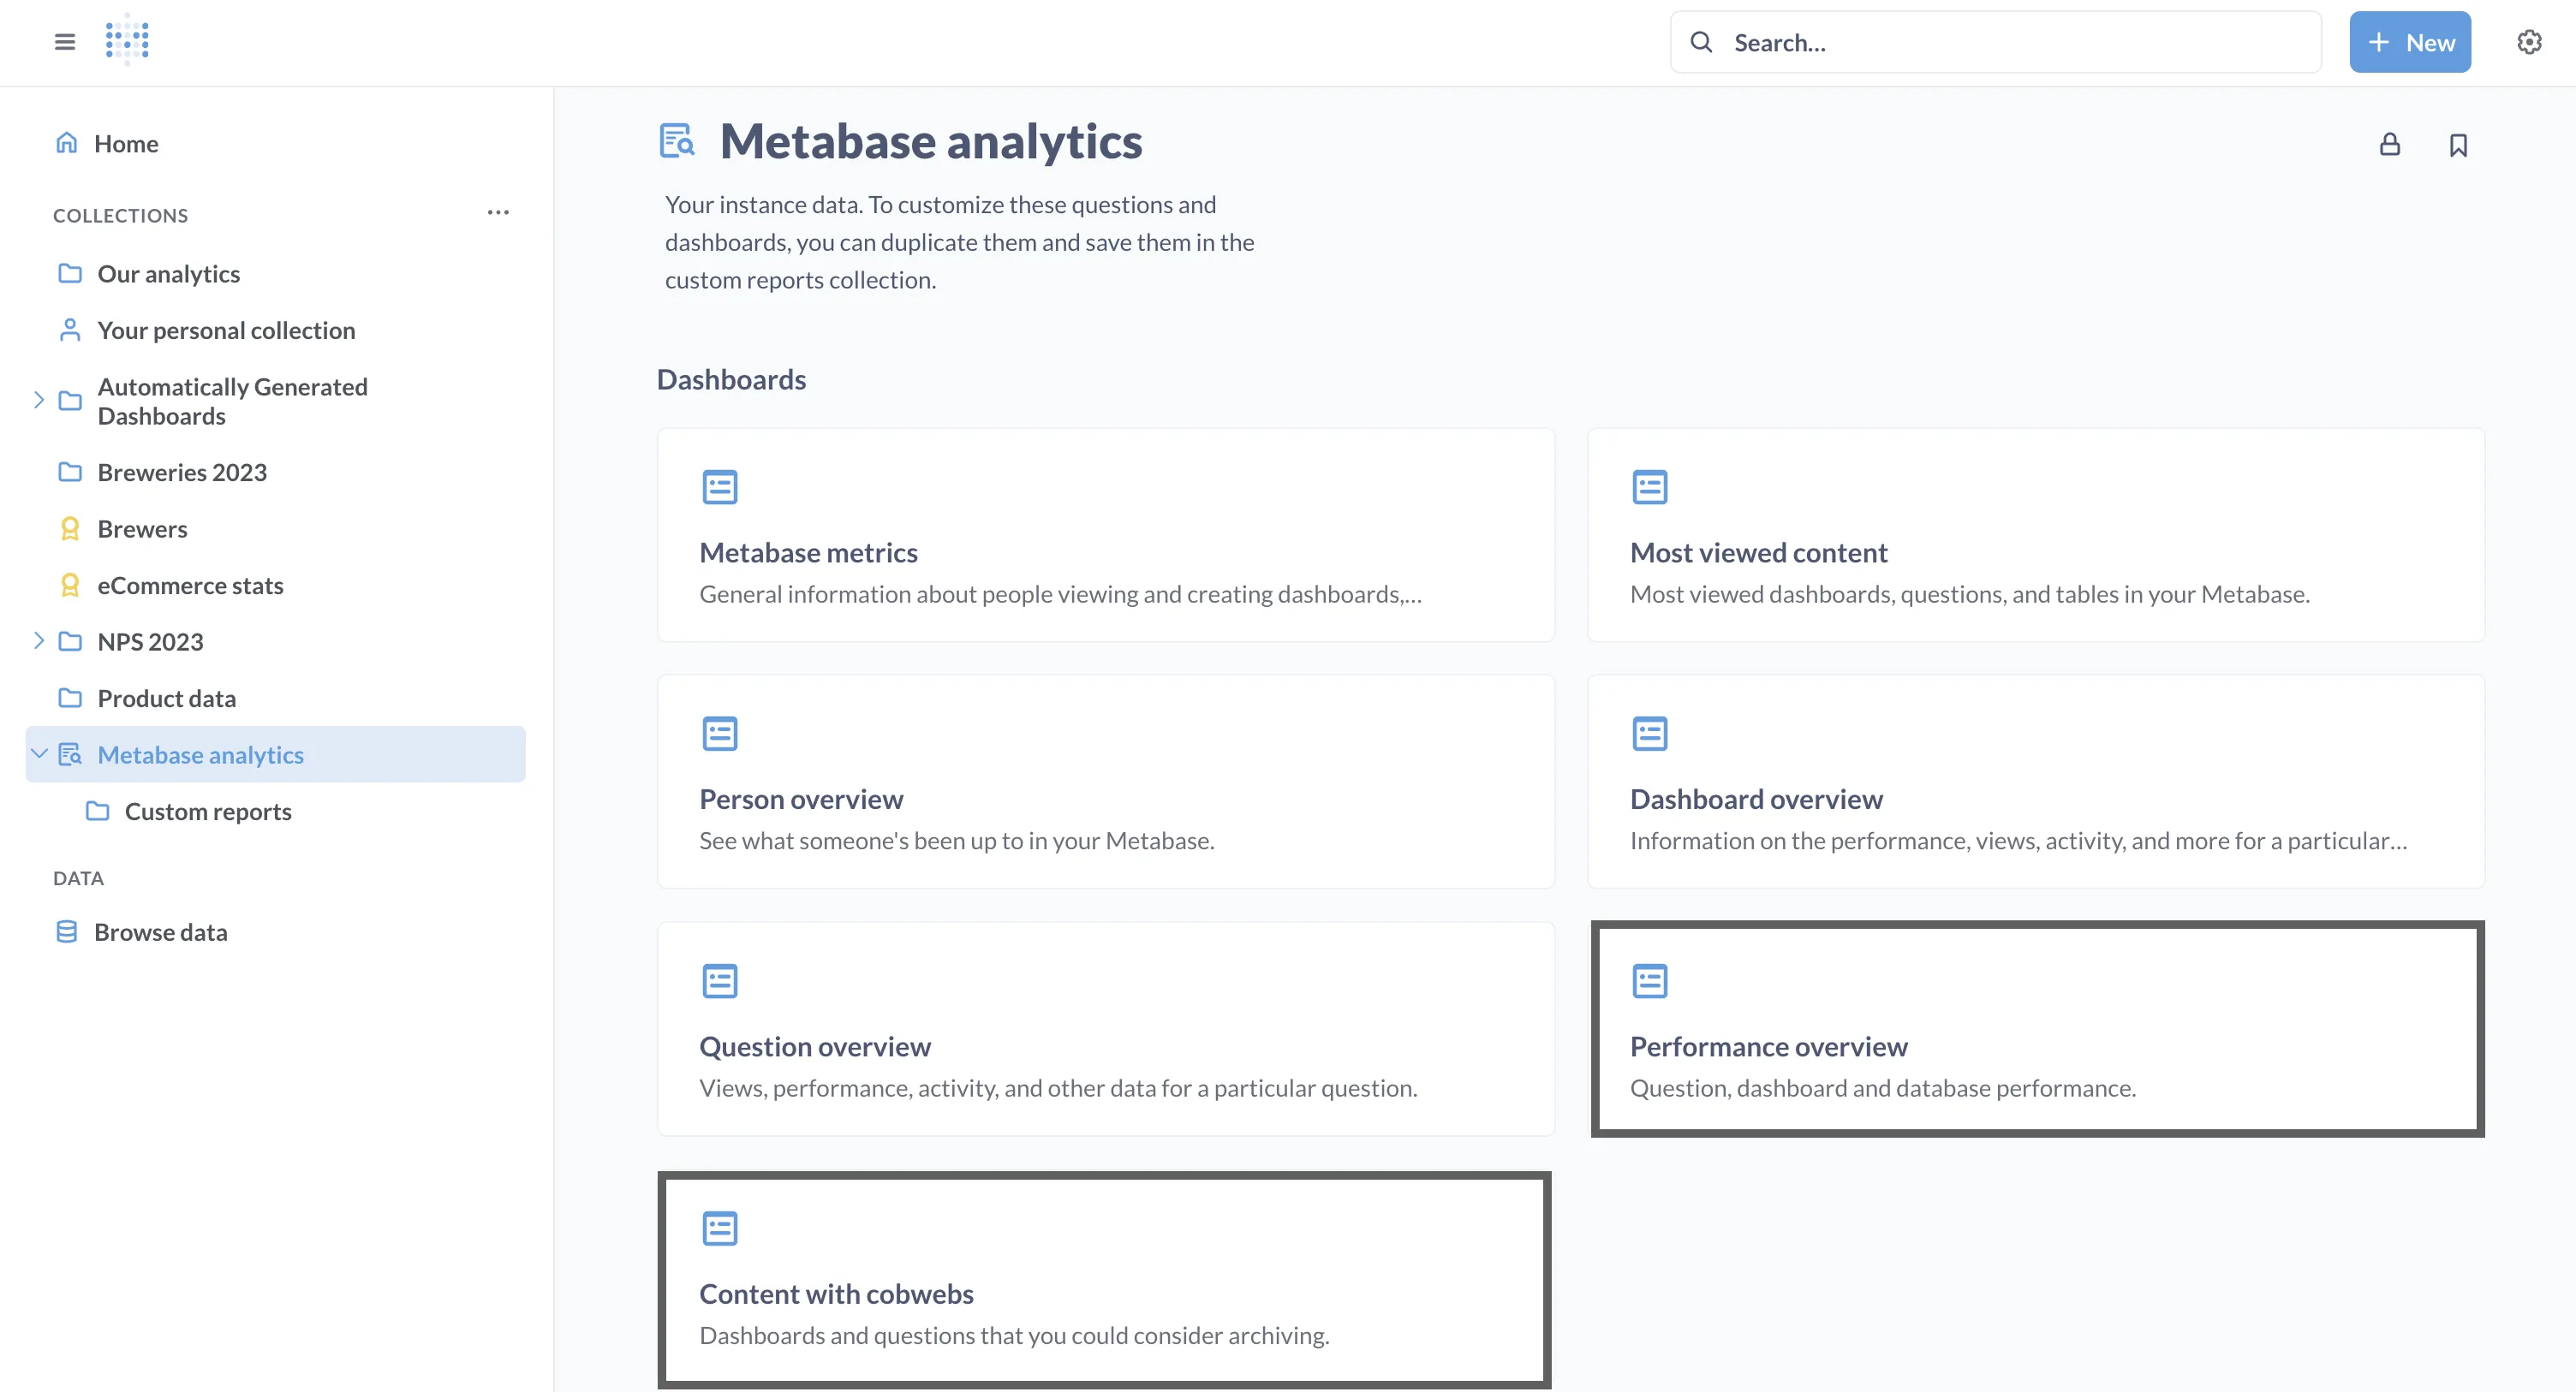
There are two different dashboards you can use to figure out which dashboards and questions are running the slowest or consuming the most resources.

-
Use the Performance Overview dashboard to find out what your slowest dashboards and questions are, and refactor, cache, or archive them.
-
Look in the Content with Cobwebs dashboard to see what’s not being viewed. It might be time to archive, or if you think people are really missing out, put this content somewhere more prominent.
Keep your data secure with multi-tenant embedded analytics
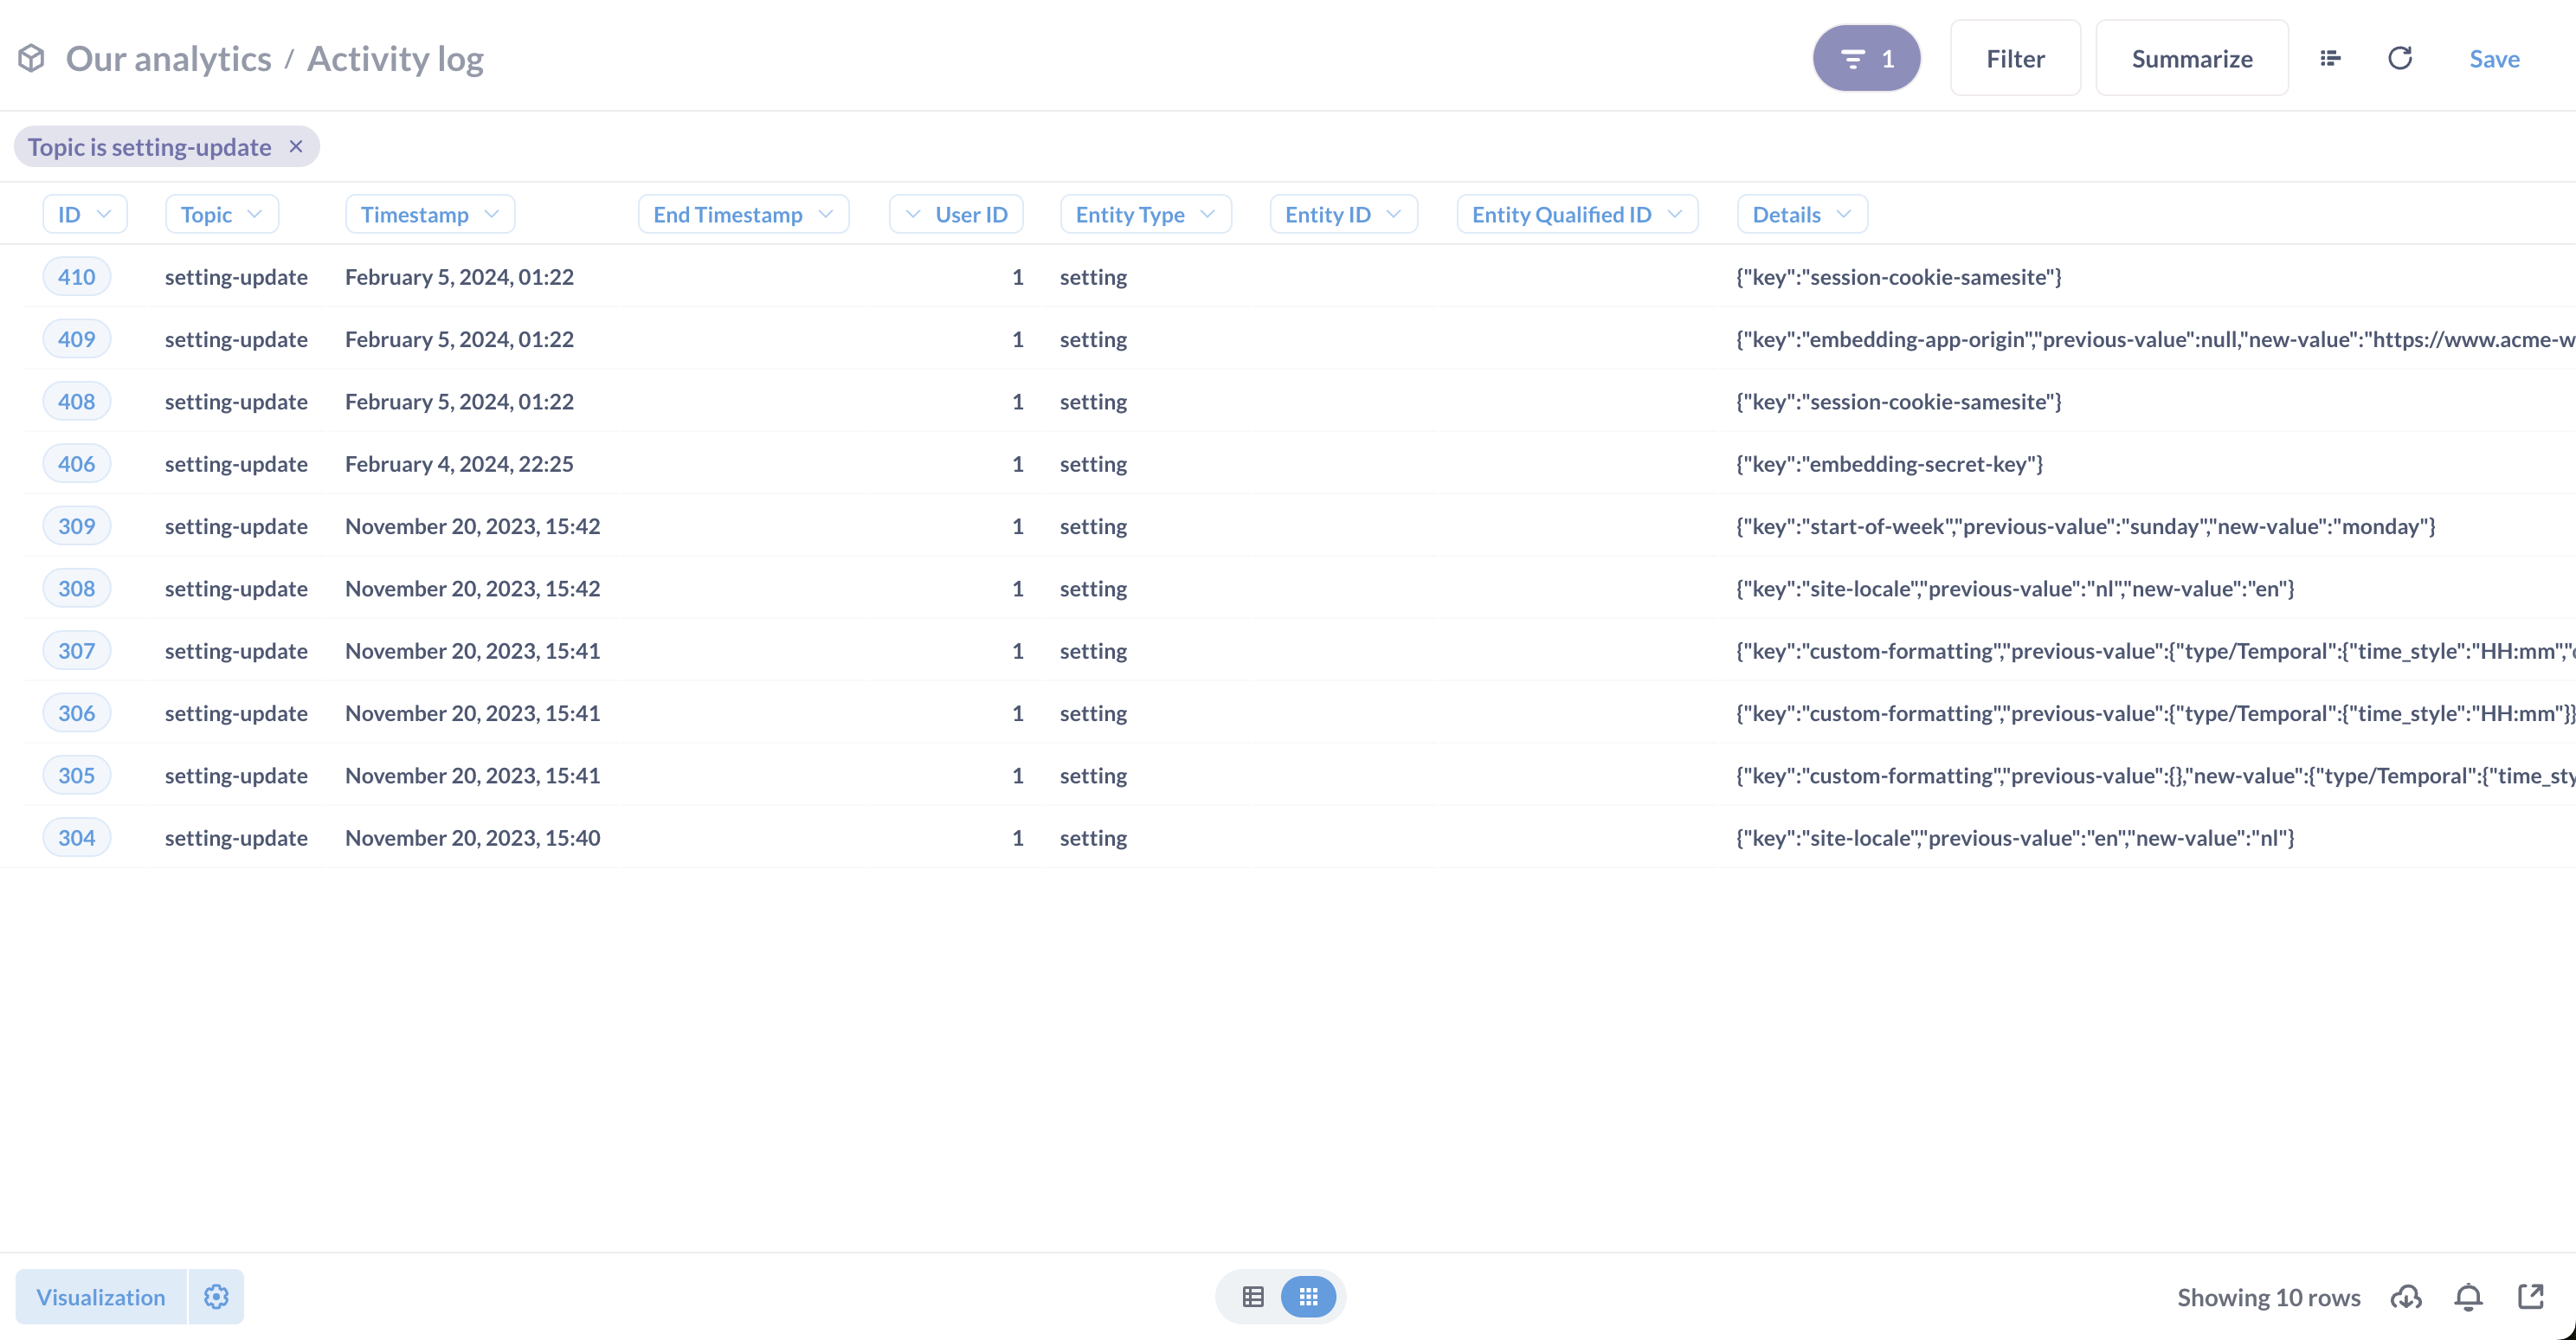
Usage analytics gives you a comprehensive log for auditing and security purposes.
You can monitor the people or activity logs for anomalies, like suspicious logins or changed settings, and set up subscriptions and alerts on questions created from these logs to keep a constant watch on what’s going on in your instance.

You can use these logs in combination with other security features, like SSO, sandboxing, and more, for secure, multi-tenant analytics.
Metabase analytics resources
Usage analytics spans beyond just tracking embedded analytics. You can also use usage analytics for internal things, like cleaning up your Metabase, giving your data team an idea of how often your data is being used, and more. Check out a few of the other ways you can use the Metabase analytics collection: