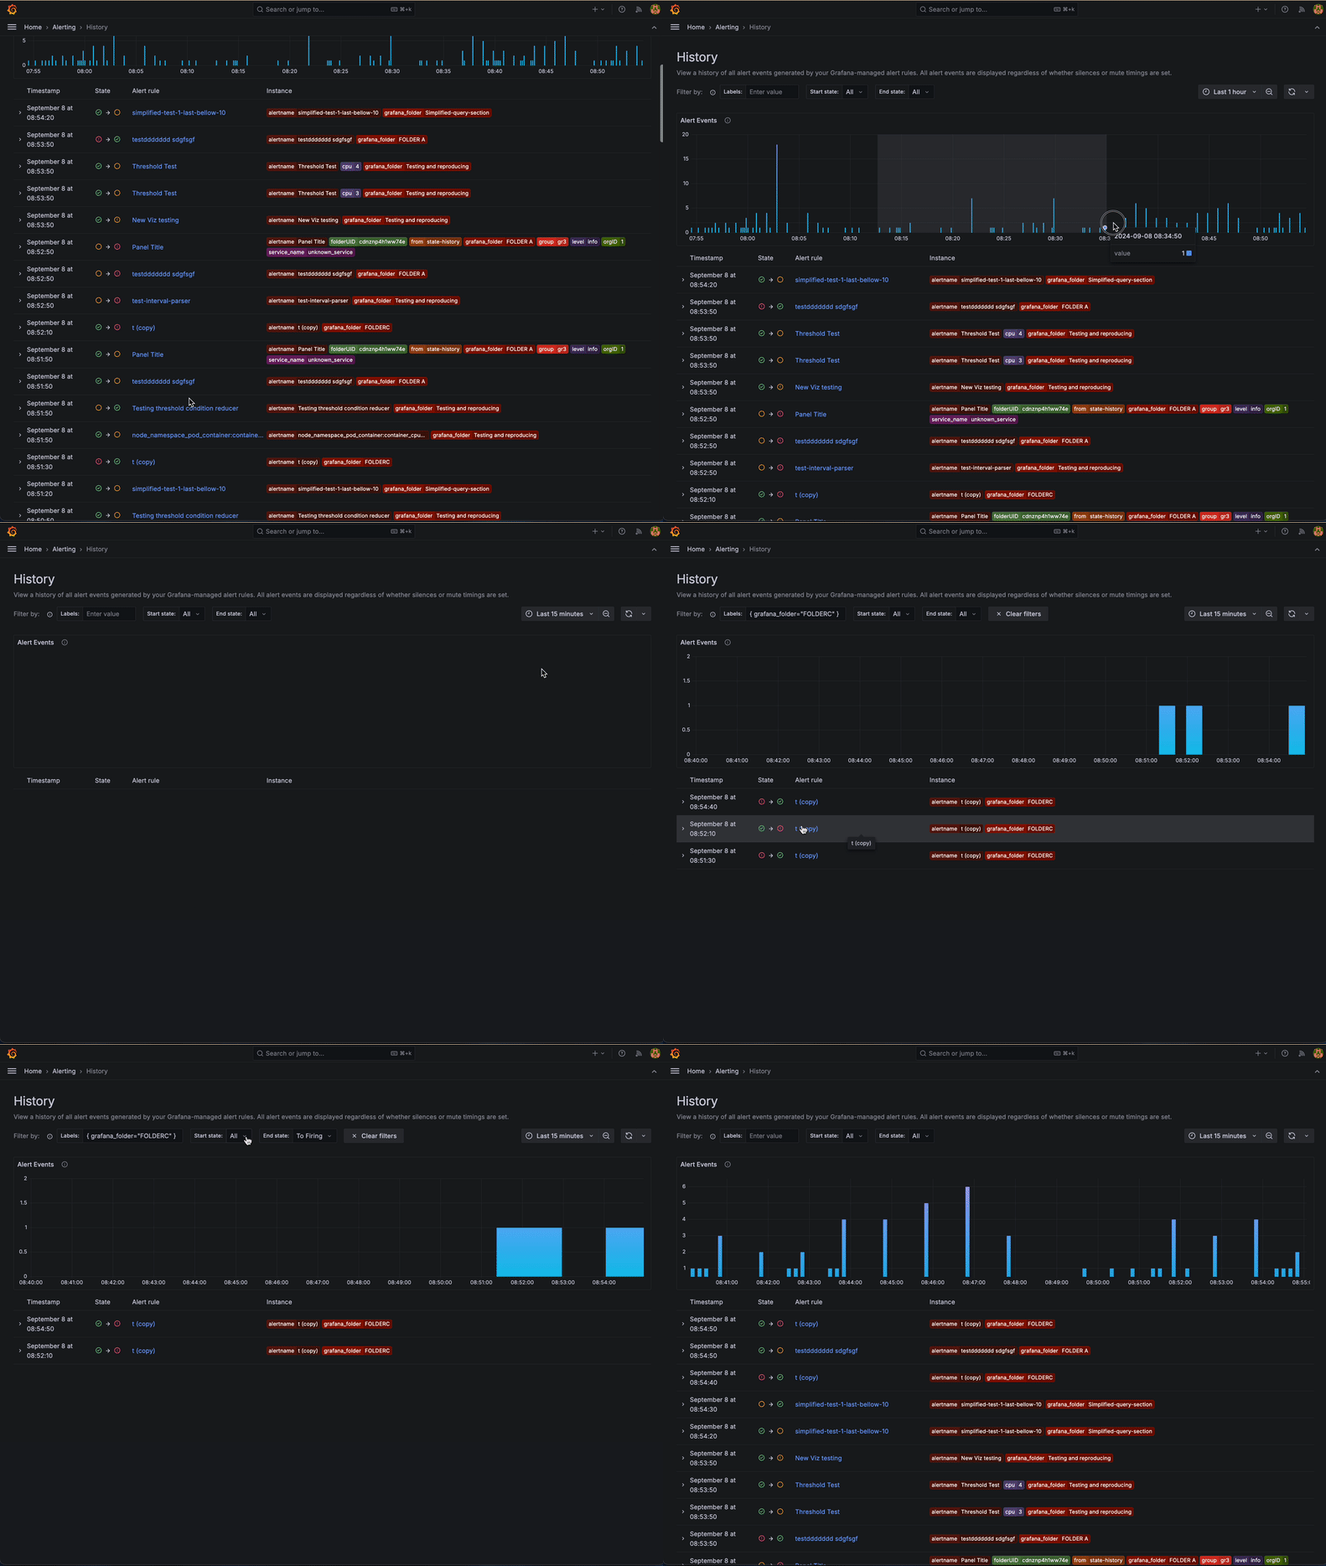
A year ago we rebuilt our alert rule state history, using Grafana Loki for storage and updating the UI to display a timeline of all state changes of an alert rule. As a result, users can now conduct better root cause analysis by going down to the level of an alert rule and seeing when certain alert instances started or stopped firing.
But we aren’t stopping there.
To ensure system stability and avert outages, you also need one place to see the state history for all the alerts in your system. That’s why we’re thrilled to announce the new history feature in Grafana Alerting. Available in Grafana 11.2, this new “History” page offers a holistic view by showing all state transitions for every Grafana-managed alert rule.
Did several alert rules fire around the same time? Now you can easily tell which one was first, or what happened just before that. Having a clear and comprehensive view of alert state transitions over time enables you to identify patterns, diagnose issues more quickly, and improve your overall incident response strategy.
Whether you’re a DevOps engineer, a system administrator, or a member of an SRE team, this feature is designed to provide the insights you need to keep your systems running smoothly.
How does the history feature work?
Access the page by clicking on the “History” item in the Alerting section of the Grafana main menu. The page has three parts — a filters section, an events chart, and an events table.
Use the filters at the top of the page to narrow down the displayed history events based on labels or state. You can also click on a label or a state in the table to quickly add it to the filter.
To define the time period you are interested in, either use the selector above the events chart or just drag an area on the chart itself to zoom into it.


The events chart displays how many historical events (an instance that changed its state from one to another) happened over time. This lets you easily spot trends or notice particular periods with a high number of events.
The rows in the table represent the individual events. Each row displays:
- A timestamp
- The start and end state of the transition
- A link to the alert rule
- The labels which define the instance
Found a particularly interesting alert rule and want to focus on it? Simply click on the alert rule name and you’ll be navigated to the History tab of the alert rule’s detail page. There you can continue your investigation without being distracted by other events.
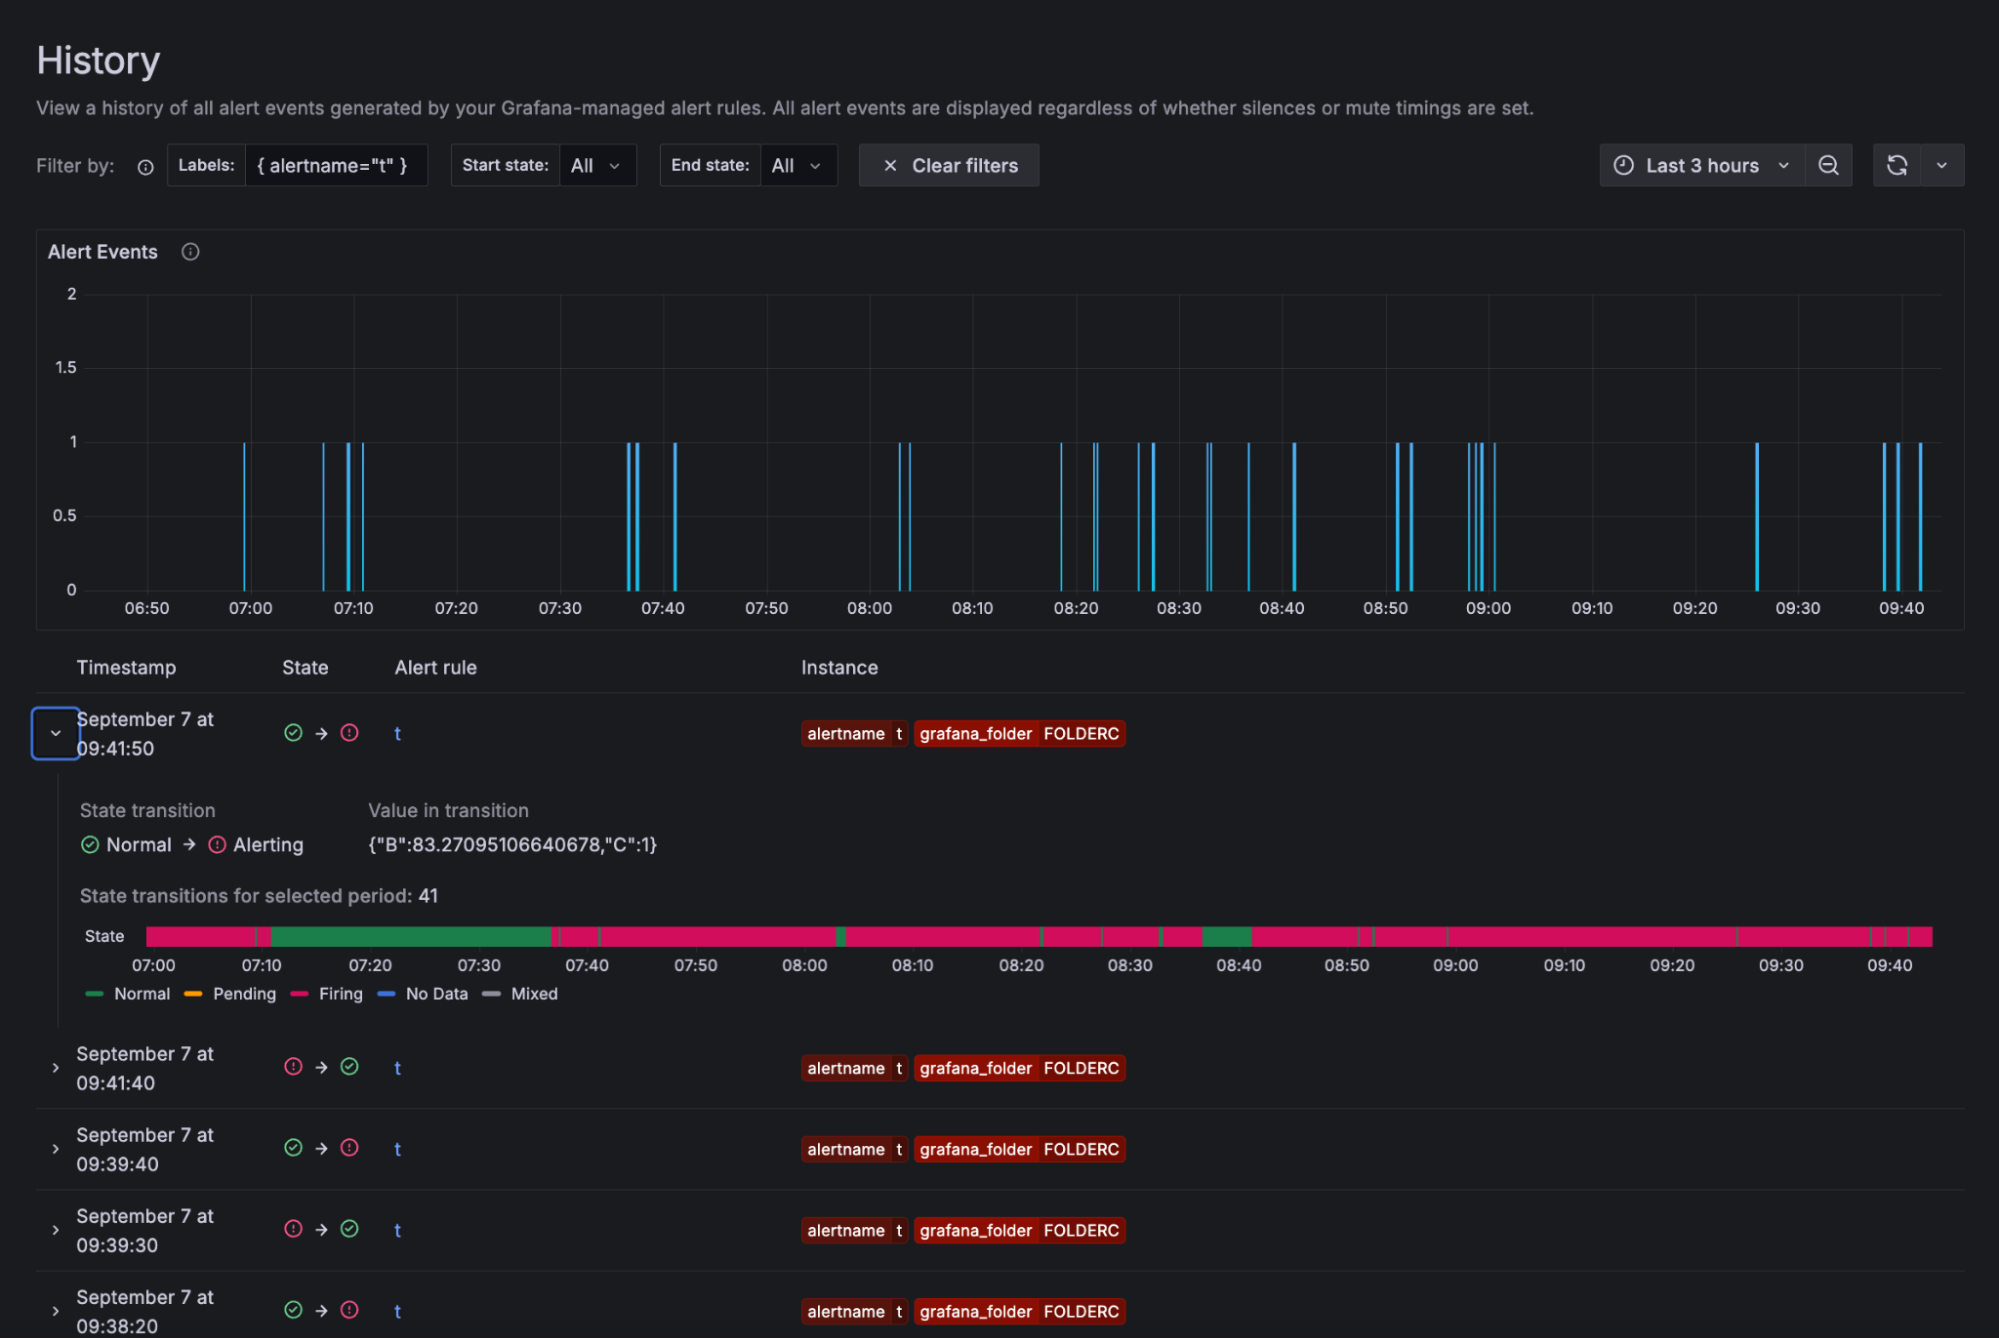
You can also expand a table row to reveal additional information — the query values and expressions of the alert rule, along with an additional chart representing the alert instance’s state throughout the entire selected time period.
For example, consider a scenario like the one below, where the chart reveals that your alert instance is frequently toggling between “firing” and “normal” during your selected period. In that case, it might be worth taking a closer look at how the alert rule is configured and then fine-tune the threshold or the pending period.


More Grafana Alerting resources
Take the alert management to the next level, and start using Grafana 11.2 today! The feature is also available for all Grafana Cloud users right now.
And to learn more about Grafana Alerting, check out our recent blog posts, as well as our technical documentation.
The easiest way to get started with our Enterprise data source plugins is in Grafana Cloud. We have a generous forever-free tier that includes access to Enterprise data sources for 3 active users. If you haven’t already, sign up for free today!