As a site reliability engineer, you need constant vigilance and a keen eye for detail if you want to manage your Kubernetes infrastructure effectively.
As part of that effort, you need to see the historical data from your pods, nodes, and clusters — even after they’ve been deleted or recreated. Many SREs rely on kubectl for this, and while it’s indispensable for real-time Kubernetes management, it presents some significant challenges with historical data:
- Manual effort: You have to continuously intervene to capture and retain the necessary data.
- Complexity: You have to orchestrate multiple commands and tools to get a complete historical view.
- Data retention: You have to set up and maintain additional infrastructure to ensure the data is available long-term.
Not only is this time-consuming and expensive, it can also open the door to mistakes and missing data. And those errors can lead to a lack of visibility that hinders effective troubleshooting, resource management, and compliance. But with Kubernetes Monitoring in Grafana Cloud, you can quickly overcome these challenges. To illustrate this, let’s follow the journey of a SRE facing multiple issues and see how historical visibility in Kubernetes Monitoring can help.
Scenario 1: Debugging post-deployment application issues
Let’s say you’re working at a bustling tech company, and you’ve just overseen the deployment of a new version of your application. Everything seems fine until users start reporting intermittent failures. Panic sets in as you realize the issue might be with the pods that were created and deleted during the deployment.
Initially, you frantically run kubectl get pods --all-namespaces to capture pod states, but the problematic pods were deleted. You then try to find logs using kubectl logs <pod-name>, but the pods no longer exist. Desperate, you look for events with kubectl describe pod, hoping to piece together the puzzle. This process is time consuming and error prone, causing further delays and frustration.
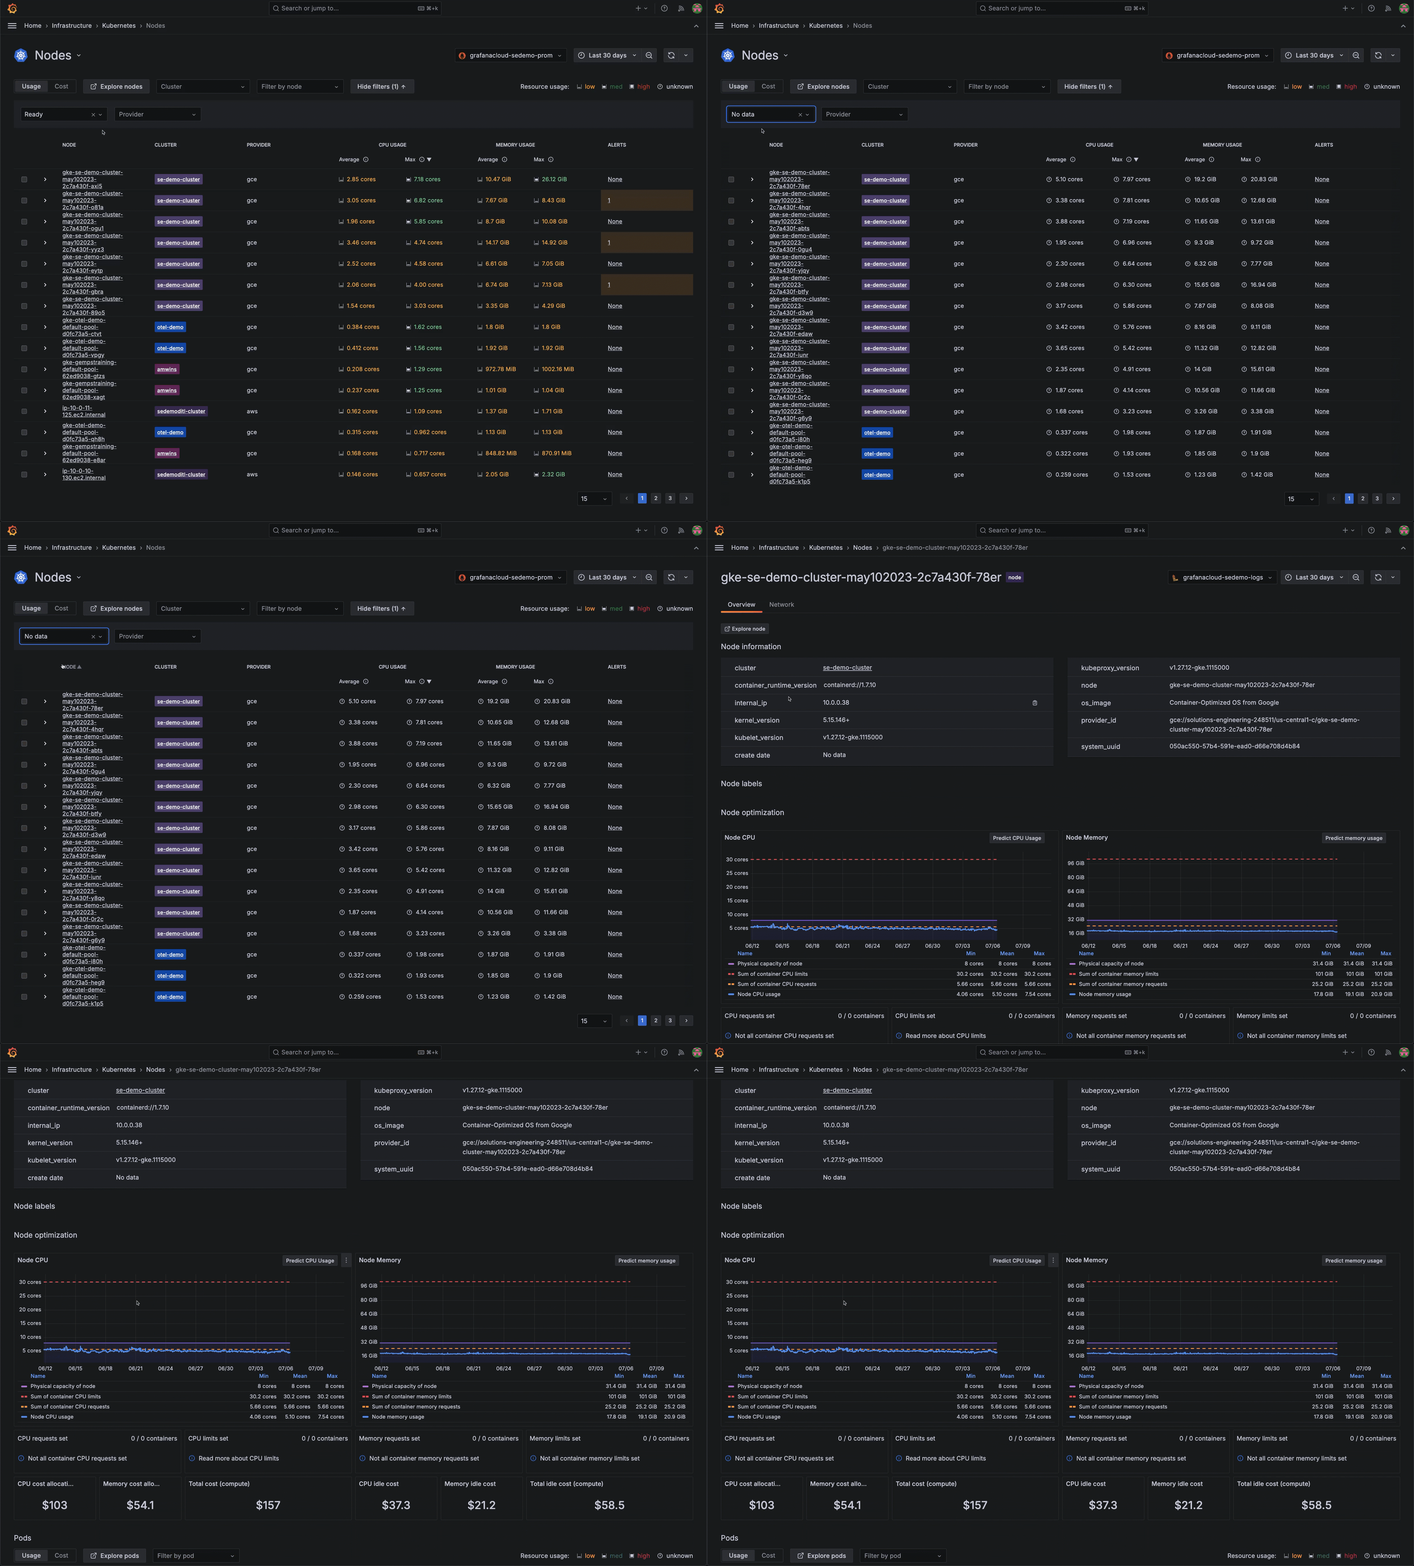
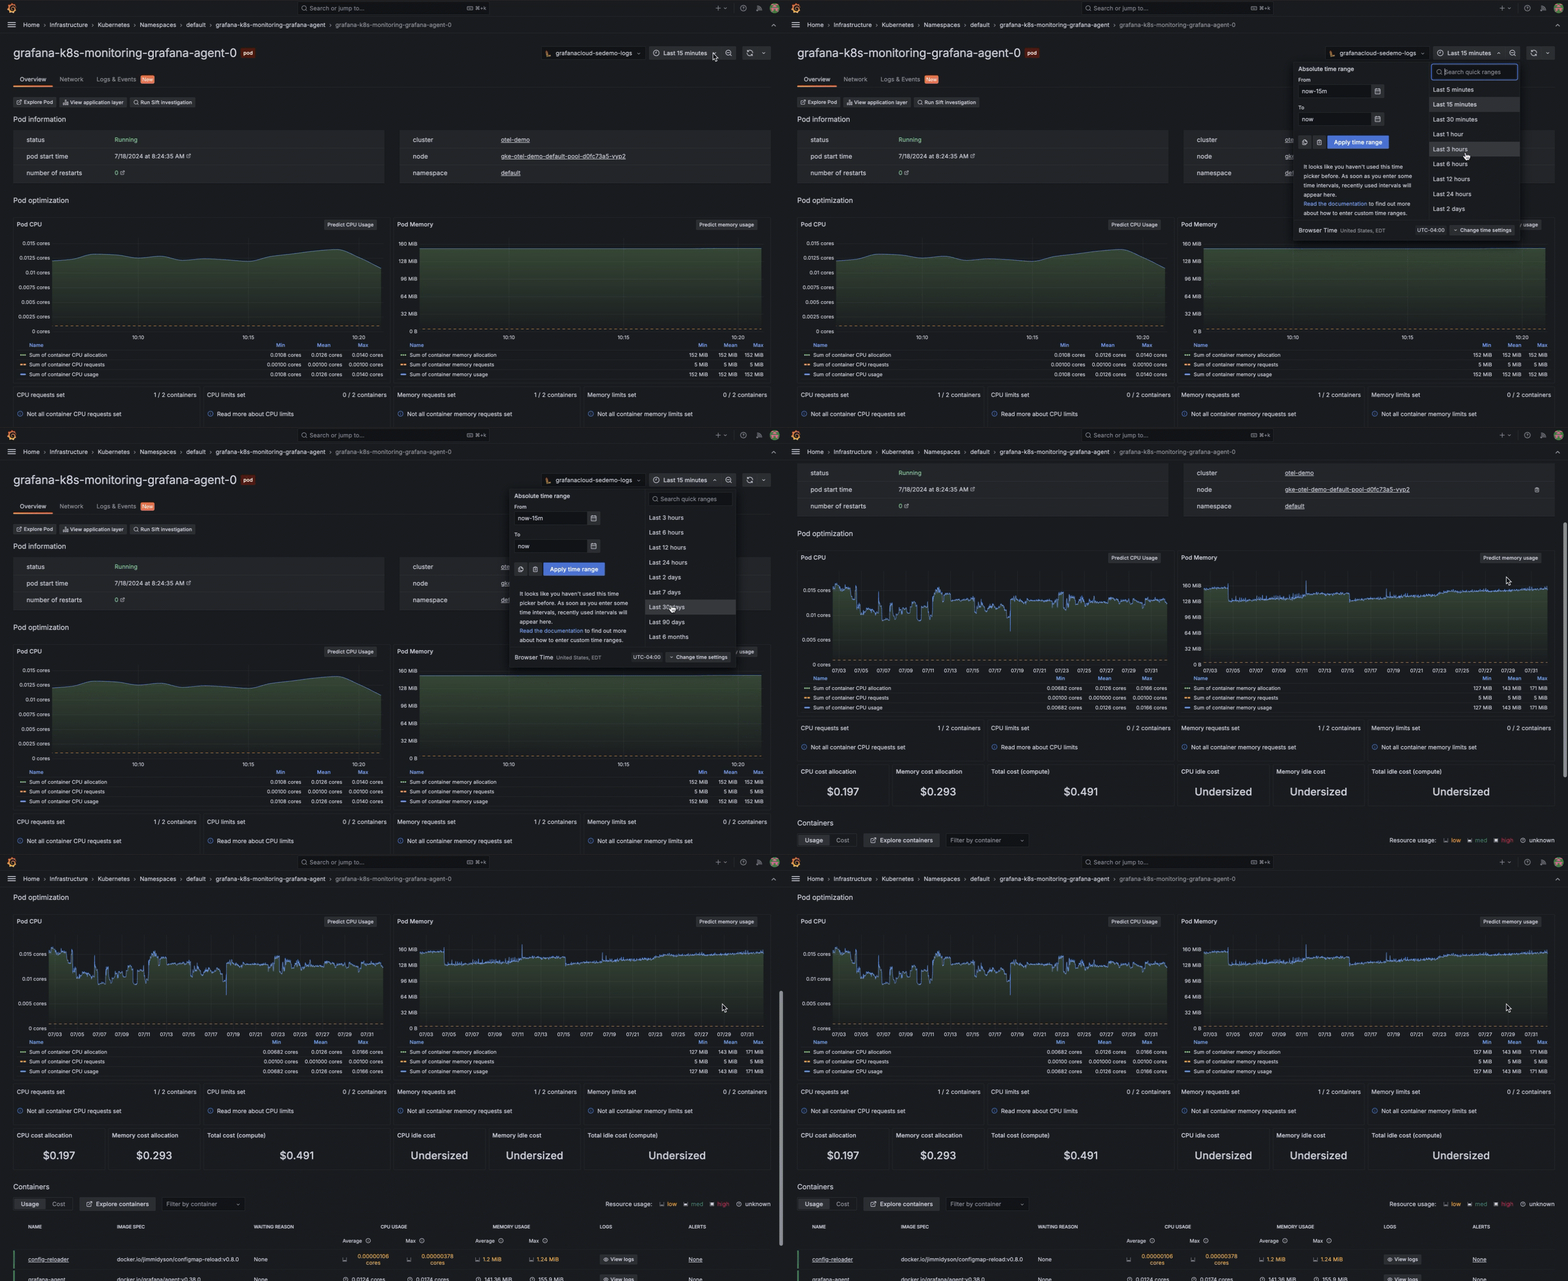
But with Grafana Cloud, you get historical visibility out of the box. You can easily view the state and logs of those deleted pods. Instead of scrambling through ephemeral logs, you’re able to calmly access a timeline that shows exactly what happened before the deployment went awry. This not only helps you pinpoint the issue but also reduces downtime and user frustration.


There are other times where historical data comes in handy for debugging. For example, maybe you’re working with an Azure Kubernetes Service cluster and you mistakenly delete all nodes, thinking the cluster would self-heal. This leads to all pods being in a pending state with no nodes available. The immediate impact is severe: applications become unavailable, user requests fail, and the overall system stability is compromised. You then decide to upgrade the cluster to bring it back to a functional state. After upgrading the cluster, nodes come back online, and pods move from pending to running state.
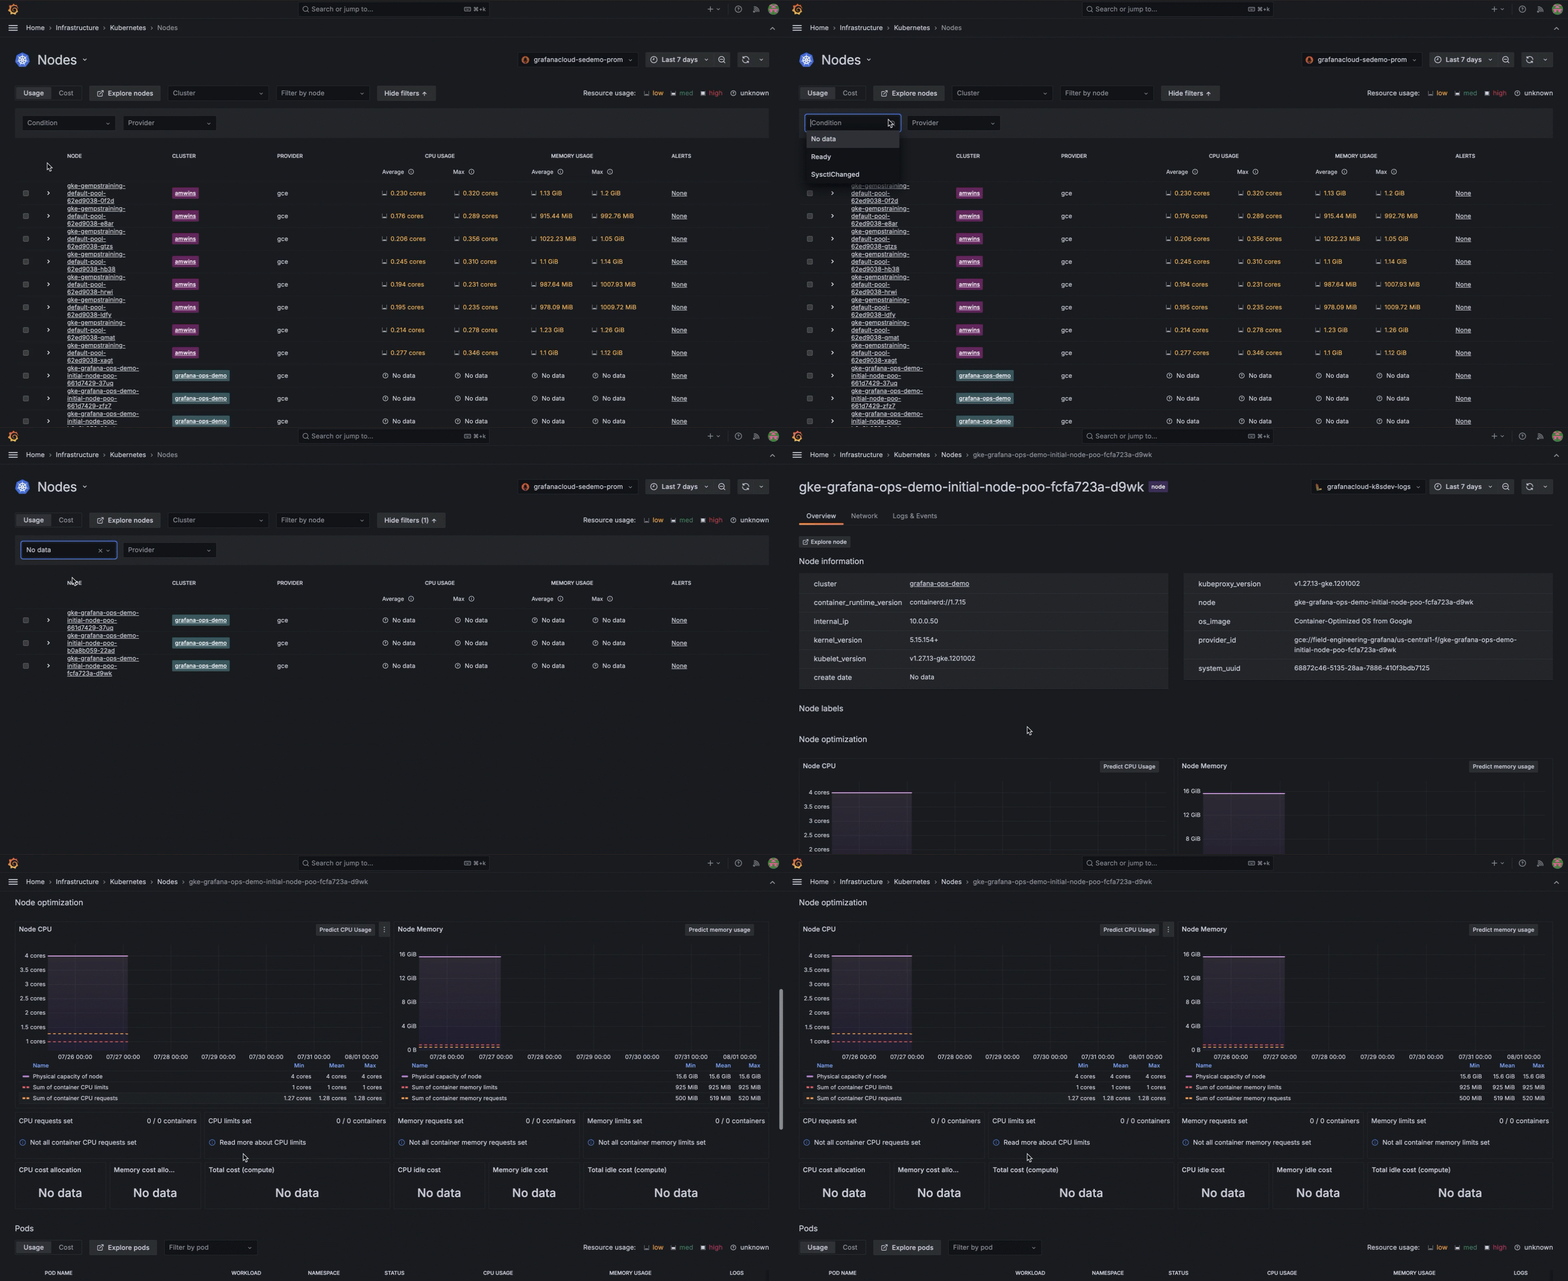
With Kubernetes Monitoring in Grafana Cloud, you can access historical visibility to understand the sequence of events leading to the issue. You can see when the nodes were deleted, the exact state changes of the pods, and how the system responded over time.


This detailed historical data allows you to identify the root cause quickly and implement preventive measures to avoid such disruptions in the future. The ability to review the entire timeline in Grafana Cloud not only helps to resolve the current issue; it also provides insights for improving the overall system resilience.
Scenario 2: Optimizing resource usage
With the deployment issues resolved, your next task is optimizing the resource usage of your Kubernetes nodes. You’ve noticed some nodes are consistently running hot, while others are underutilized. Using kubectl, you can check current usage with commands like kubectl top nodes and kubectl top pods. But it requires more effort to understand past usage trends.
To achieve this with kubectl, you must:
- Set up persistent logging solutions to capture metrics over time.
- Periodically export and store these metrics manually.
- Painstakingly combine data from various sources to get a historical view.
Kubernetes Monitoring in Grafana Cloud replaces this tedious process. Historical data on node and pod resource usage is readily available, which allows you to analyze trends and make informed decisions about resource allocation. This level of visibility helps you optimize your infrastructure for a more efficient and cost-effective operation.


So, there you are in the middle of a resource optimization task, when you remember the cumbersome, manual approach you used to perform to export metrics periodically and store them for historical analysis. But with Grafana Cloud, your historical data can be viewed directly, so you can make quicker and more accurate decisions about resource allocation.
Scenario 3: Analyzing past incidents for better future planning
Just when things seem to be running smoothly, a major outage occurs. As an SRE, it’s your job to analyze the incident and ensure it doesn’t happen again. You need to look back at the state of your Kubernetes infrastructure before, during, and after the outage.
If you were to use kubectl to complete this task, you would have to follow a series of steps that presents the same challenges we’ve been discussing throughout this blog:
- Manually record the state of pods and nodes at regular intervals.
- Correlate logs from various sources to reconstruct the sequence of events.
- Piece together data from different tools to get a comprehensive view.
This can lead to incomplete analysis and overlooked root causes. For example, let’s say you discover the outage happened because a particular node was lost after an upgrade, causing significant disruption. It would be difficult to piece together the event logs and states of the nodes manually.
Instead, you could use Grafana Cloud to quickly access historical data and understand the sequence of events that led to the outage. With the Kubernetes Monitoring, you can identify patterns and root causes of the incident with ease. And with a few clicks, you can visualize the state of your clusters over time, correlate metrics and logs, and derive actionable insights that translate to more effective incident analysis and better planning for the future.
Start using Kubernetes Monitoring today
There are good reasons to delete pods and nodes in Kubernetes, including:
- Application updates: Deploying new versions of applications that may require deleting old pods.
- Scaling operations: Adjusting the number of pods or nodes to handle varying loads.
- Security concerns: Addressing vulnerabilities by removing compromised or outdated pods.
But as we’ve shown here, it can lead to significant problems when it isn’t handled properly. Kubernetes Monitoring in Grafana Cloud turns potential nightmares into manageable tasks, making it an essential tool for any SRE, cloud infrastructure admin, or developer. For more information, visit the Kubernetes Monitoring documentation.
Grafana Cloud is the easiest way to get started with metrics, logs, traces, dashboards, and more. We have a generous forever-free tier and plans for every use case. Sign up for free now!