
As Zabbix got the new fantastic Selenium-based synthetic web tests, you will now have a new component to monitor. How do you monitor Selenium? With Zabbix, of course! If you are impatient, feel free to download my very bare-bones example template.
How to monitor Selenium?
That part is easy. Selenium server exposes you at <your-selenium-URL>/status, for example, http://my.selenium.server:4444/status — the data from there is coming back as JSON. Either grab it all via LLD, low-level discovery rules, or just cherry-pick a few values to follow. I cherry-picked a few values, as the status contains so many items I would not ever need. No, my Selenium is not going to test stuff through the Microsoft Edge browser, for example. Below is a short snippet from the status page output.
{
  "value": {
    "ready": true,
    "message": "Selenium Grid ready.",
    "nodes": [
      {
        "id": "e284925e-c341-41fc-8380-581ead4987b6",
        "uri": "http:u002fu002f0.0.0.0:4444",
        "maxSessions": 10,
        "osInfo": {
          "arch": "aarch64",
          "name": "Mac OS X",
          "version": "14.5"
        },
        "heartbeatPeriod": 60000,
        "availability": "UP",
        "version": "4.21.0 (revision 79ed462ef4)",
        "slots": [
First, confirm that your Selenium gives you back that status page. Done? Done. Next, move on and create a new Zabbix template.
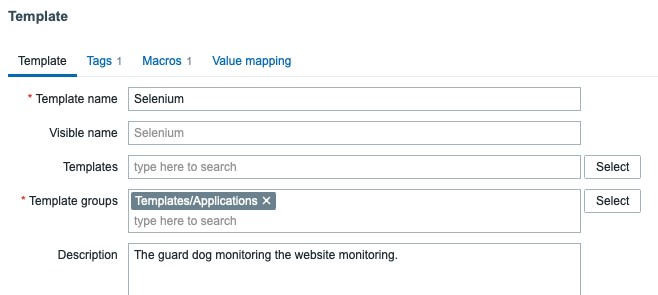
Create a new Zabbix template
Go to Data Collection -> Templates -> Create template, give it a name, and assign it to any template groups you want.
Next, click on Macros tab, and enter there {$SELENIUM_URL} = your.selenium.server.address/status
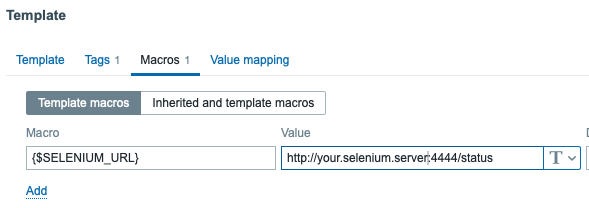
Done. Now save your template and start adding items.
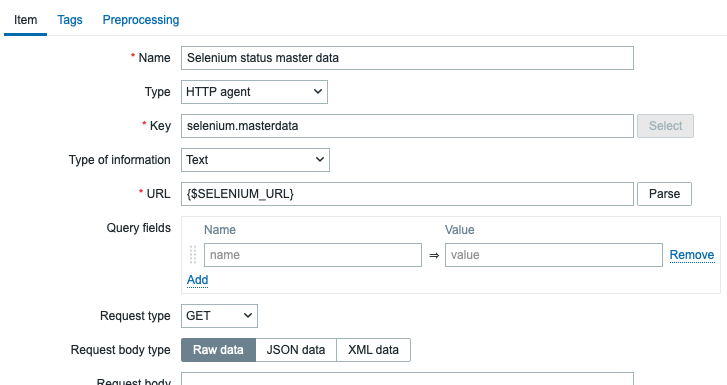
Add new items to the template
First, add a new HTTP agent type item for fetching the master data.
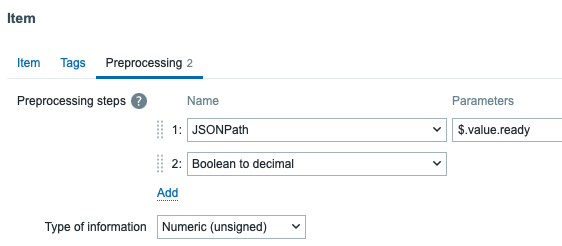
Next, just add any items you would like to pick from the long JSON output: as I’m only interested if Selenium is ready and what is the message it is returning, here is an example of how I grab the items. First, the one that checks if Selenium is ready (true/false).
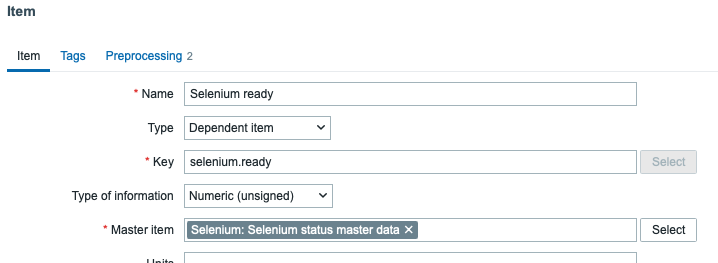
… and get that with item pre-processing by using JSONPath and Boolean to decimal, so you get numeric values for graphs and so on.
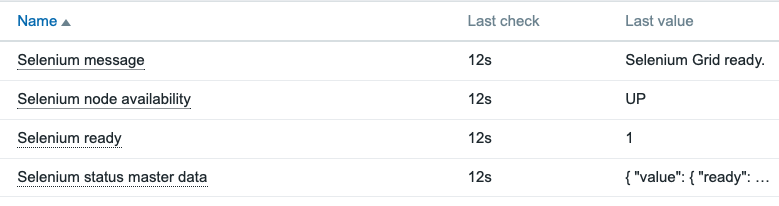
The end result
After this, you are already monitoring your new Selenium to make sure that it is feeling well.
Now go and add your Selenium to monitoring, too! Add some triggers and visualize it for yourself by using some of the new fancy widgets we have in Zabbix 7.0!
This post was originally published on the author’s page.
The post What’s Up, Home? – Monitor your new Selenium appeared first on Zabbix Blog.